Yogesh Upadhyaya

Yogesh

0

Understanding Warfeatured

January 03, 2024

I fear that we will see a big multicountry war in the next decade. This feeling could have arisen because of conflicts in Ukraine and Gaza and because of rising tensions between the big powers of the world. It could be because I have been reading a lot of history in the last year and because Covid has made it easier for us to think the unthinkable. Or it could be just a consequence of increasing pessimism that comes to many of us with age and weakening digestion. The feeling led me to try to understand war. I wanted to understand which factors determine the outcome in a war and whether we can predict who would win? This post is an exploration of these questions. Disclaimer: If you are a warrior or a scholar of war, you may find this post very basic.

A lot of my understanding comes from the excellent “Allure of Battle” by Cathal J. Nolan. The book is a journey through the wars of Europe over centuries and I highly recommend it.

Representational Image by Defence-Imagery from Pixabay

The first thing that I understood about wars is that there is no wishing them away. Wars change society and they have happened frequently in the past.

Wars are consequential and frequent

Understanding war does not mean supporting it. We can all agree that wars are horrible. But we also need to acknowledge that they are consequential. As Nolan says,

‘… war remains hugely important in explaining much history and wider human affairs. Indeed, it may be the most important thing. Armed conflict is too important to be reduced to bromides that “war doesn’t solve anything.” War in history has in fact decided many truly important things…that war remains the most expensive, complex, physically and emotionally and morally demanding enterprise that humans collectively undertake.’

Not only are wars consequential, they happen depressingly frequently. Reading the book, I got the feeling that European history is one of war after another war. Each more devastating than the previous one. The occasional periods of peace only served to lull people. For example just before 1914,

‘Serious people said that war could never happen… Panglossian economists and editorialists wrote that war’s time was long past, that the world had entered a new era of integrated markets, historical material prosperity, remarkable scientific advances, social and even moral progress…Norman Angell’s The Great Illusion was an international bestseller from 1910 widely deemed profound and prophetic. He wrote that the economies of all the major powers were so intertwined that war would no longer profit any country, as it must interrupt trade.’

Yet, just four years later, we had a war so widespread and devastating that it is called World War I.

Initiators of the many wars often believed that they were starting a short war that they would win in a decisive battle. Reality did not always cooperate with their beliefs. But before we go there, let us first look at what is ‘winning’ in a battle?

What is winning a battle?

It is easy to say who won in a cricket match. Not in a battle. How would you keep score? Is the side who has possession of the battlefield the winner? Or is it the side which has lesser casualties?

Many battles were fought in the War of Spanish Succession. One of the more famous battles was fought at Malplaquet. The French army was retreating in the war as it fought a coalition of Danes, Dutch, English and many other nationalities. The French commander, Marshal Claude Louis Villars, hoped to induce the allies to attack him at a location of his choosing.

The allied army did attack the French and a furious battle ensued. Vilars himself was wounded in the fighting and had to be evacuated. Over the period of the battle, the higher number of allied soldiers and superior guns began to assert itself. The French made an orderly retreat. The allies had the field and their co-commander Duke of Marlborough claimed Malplaquet as his great victory. And yet, ‘an astonishing 24,000 Allied killed and wounded lay upon the field including Prince Eugene’, Marlborough’s co-commander. The French in contrast had only 11,000 casualties.

In response the Duke of Marlborough’s victory claims, Villers had this to say to his emperor Louis XIV,

“If God gives us the grace to lose another similar battle, your Majesty can count on his enemies being destroyed.”

Nolan believes that the heavy casualties in Malplaquet shocked the Dutch and British leadership. Their resolution to carry on fighting weakened. To them Malplaquet showed that France, although weak, had a lot of resilience left. Nolan has no doubt that the allies were defeated at Malplaquet.

In absence of score keeping, it is not easy to determine who has won a battle. Understanding war becomes more complicated because winning a battle often does not mean winning the war.

Winning the battle does not mean winning a war

Nolan argues that battles are rarely decisive, especially in long wars. History has many examples of generals who inflicted crushing defeat on their opponents in a battle but could not win the wider war.

A remarkable example of this phenomenon is Hannibal’s campaign. The Carthaginian general Hannibal Barca crossed the Alps and attacked the ancient Roman empire. He totally destroyed an entire Roman army in a battle at Cannae. Perhaps 70,000 were killed at the cost of 5,000 of his troops. Yet, even this huge battle defeat did not lead to a defeat in the war for the Romans. They realized that it was unwise to meet Hannibal in open battles and started relying on their fortified towns unless it was absolutely necessary. When he was challenged to a battle in his campaign of 15 years, Hannibal always won. Yet, he had no sustainable result. With a combination of superior logistics and supplies, blockading of Hannbal’s supplies, attack on Hannibal’s home base and strategic alliances and tactics of avoiding battle, the Romans wore out Hannibal’s army. He lost his first and final battle in defending his home from the eventual Roman counter attack.

A great example of winning the battle but not the war is the Battle of Borodino. The battle came after Napoleon’s Grande Armée had marched hundreds of miles in Russia having fought only one battle. This was because of a deliberate Russian strategy. The Russian army kept retreating while stripping the land of food and poisoning the water so that the French army would not have supplies. The French army was stretched on difficult roads and was attacked by Cossacks on its flanks and rear. Disease, starvation and desertion weakened the marching army. At Borodino, Napoleon had the possession of the field as the Russian army retreated in the night. The French army also had fewer dead than the Russians. Against the 45,000 Russian casualties, Napoleon lost 35,000. And yet, it can be said that the battle of Bordino was the beginning of the end of Napoleon. The Russian retreat was orderly which meant that there was no wholescale slaughter. The Russians could also replace their casualties much more easily than the French could. The French entered Moscow few days later. Most of the civilians had already left. Napoleon stayed overnight in the Tsar’s palace but woke up to the city burning. Saboteurs had set Moscow on fire to deny the invading army shelter. Napoleon’s army began its retreat in slightly more than thirty days.

Napoleon had entered Russia with 640,000 men in mid summer 1812. By the time he had reached to within 100 miles of Moscow, the army was reduced to 130,000 fighting fit men. Many men and animals were killed in the march because of lack of water and food and because of disease. When foragers from the French army tried to go deeper into Russian territory for food, they were harassed by Russian light cavalry. The French army also lost many men because of desertions. Of the 6,40,000 that crossed the Niemen river on the way in, fewer than 50,000 recrossed it in winter. Russians buried or burned 400,000 men left behind.

If winning battles is not as important as most people think, then what is? To understand this, let us build a grossly simplified model of a conflict. Keep in mind the aphorism that all models are wrong but some are useful.

A crude model of conflict

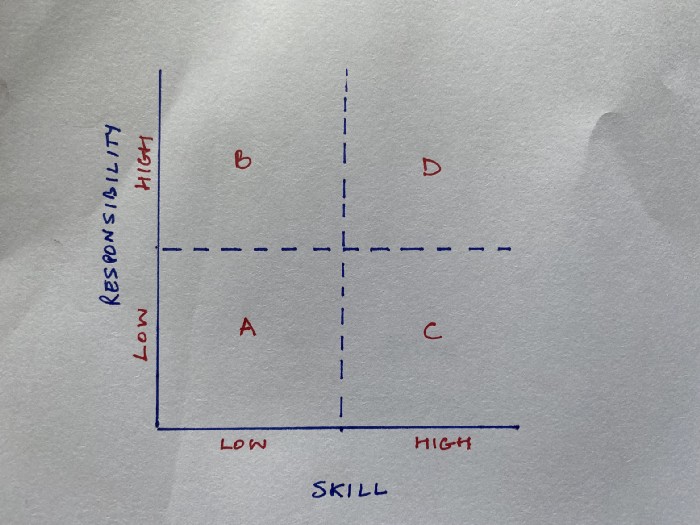
What will happen if ten armed men are fighting fifty other armed men? The correct answer is that ‘it depends.’ Here are some of the things that it depends on.

  • What is the range and accuracy of the guns that the men have? If the range of the guns of the ten men is much longer than that of the guns of the second group, it is possible that the ten prevail if they manage to stay far enough away from the fifty.
  • What is the age and training levels of the two teams? A smaller but younger and well trained team could beat a much larger but older and untrained force.
  • What is the firing rate of the guns? If the ten men are fighting with automatics but the fifty are fighting with centuries old muskets, it is possible that the smaller team wins.
  • What is the cover that the two teams have? Is the smaller team defending from behind heavily fortified structures and is the larger team attacking it? Can the defending team use natural barriers like mountains or rivers? If yes, the defending team could have a huge advantage.
  • Can the attacking force concentrate its force to make a breakthrough in the defenses? The attacking force could then isolate and overwhelm the defenders.
  • What are the motivation levels of the two teams? Is it that the smaller defending team is fighting for its life whereas the larger team is attacking because it has been told to?
  • What is the supply support that the two teams have? A higher firing rate may cease to be an advantage if you run out of bullets. A good defensive position may not remain an advantage if you cannot get water, food and ammunition.

Already our model of micro battle has become very complex. The complexity comes from various combinations of the above factors. For example, the defending force may have very good cover but may not be anywhere as well trained as the attacking force. When we scale this battle, complexity increases exponentially.

One general principle of war however is that defense is much easier than offense.

Defence

The Russians defended against Napoleon by retreating and by denying his army access to food. They would defend again more than hundred years later with Hitler’s army. Defense is what the allied army led by Duke of Wellington began with against Napoleon in Spain and Portugal. Romans did it against Hannibal centuries earlier. If not taken by surprise, a defending army will lose fewer men and lesser material as compared to an attacking army.

A defending army can choose the location for its defense. The geography may make it very difficult to attack. The defending army would build additional fortifications to make the attacking army’s work even tougher. These fortifications were literal fort walls centuries ago and now may be lines of underground trenches and bunkers supported by heavily mined areas. Last but not the least, the defending side is usually near its home and hence, its supply lines are much shorter.

Why attack?

The losses in battle of an attacking side are generally much higher than that of the defender. So why doesn’t everyone just defend? Well for one, the attacker can cut off a defender’s supply lines.

Why not defend? Starvation is a strong motivator

In medieval times, when defenders retreated behind thick walls, attackers would surround the fort to ensure that no food went in. Long sieges were not easy but if they were effectively implemented, the defending side would need to move out and offer battle. The attacking side could provide extra motivation for the defending side to venture out by indiscriminately attacking the civilian population outside the forts making it morally urgent for the ruler to venture out of the forts to defend his subjects.

This tactic of starvation and killing of civilian population did not die out in the middle ages. In World War II for example, both sides attacked each other’s supplies of food and fuel. As Nolan says

‘All the major belligerents in World War II returned to starvation as a major instrument of policy and of their war effort, whether by naval blockades or direct food confiscations.’

WWII also saw deliberate targeting of civilian populations to reduce the morale of the enemies. The atrocities of Germans in WWII are extensively documented but it was not that the other side was totally innocent (I am not drawing a moral equivalence here). As Nolan reports

‘Civilians were not killed as collateral damage in precision attacks that went awry, they were deliberately targeted in “morale bombings.” By the end of, Western Allied crews and policy destroyed 120 cities in Germany and 62 more in Japan, as firestorms reduced buildings and people to ash under incendiaries seeded by the air forces of the democratic nations.’

Even without starvation and ‘morale bombings’ one side or the other may be tempted to leave its well fortified positions at attack because an attritional conflict may become a question of who has more men and material and one side feels that it is at a disadvantage in the long run.

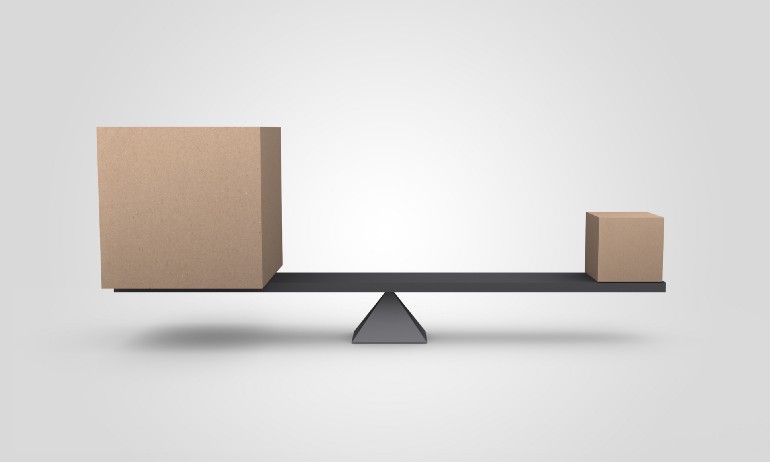
Why not defend? Attritional war is a war of men and material

Wars test supply and logistics in ways that peace times just cannot. Take ammunition. The rate of production of ammunition in peace times is not even a small fraction of what may be needed in war. Here is Nolan on World War I.

‘Fighting slowed in the first months of 1915 as artillery in all armies was retarded by an across-the-board shell shortage. Batteries started to hoard shells, as individual guns were reduced to just five or ten rounds per day, sometimes to just one, defeating the design and purpose of rapid-fire, self recoiling modern guns. Shell manufacturing during Prussia’s 19th century wars was 7,000 per week. By 1915 each army needed 20 times that production per day.

The shells don’t just have to be manufactured, they have to be taken to the frontlines and distributed to individual guns spread over the front on a regular basis. All the while ensuring that you protect them from the enemy guns, planes and saboteurs who are trying to cut out your supply lines.

Your army may struggle with something as basic as fuel. This could be because countries that you thought were your friends refused to supply you with Oil. Or it could be because your enemy has blockaded your supplies as the United States did to Japan in World War II. Only 9% of Japanese tankers made it through US navy blockade in the last 15 months of World War II. That meant no fuel for the Japanese industry, the effect of which would cascade through to arms and ammunition.

Armies don’t just require ammunition. The men have to be fed and supplied with other necessities. Here is a small passage talking about the logistics of the French Front in WW I.

‘Behind the fighting lines the land was crisscrossed and traced with military roads and railways; with long earthworks, endless rows of pine barracks. Fortified canals; with bunkers, depots, tank park and cemeteries; with R&R camps and brothels. Everything was serviced by seaside docks and busy ports that brought men to fight, women to nurse, food and war material from all over the world. It took 100,000 cooks to feed upwards of two million men on the Western Front alone, every day, despite frontline troops eating cold food such as tinned bully beef, hard cheese and harder biscuits.’

War time shortage of material could be for something less obvious than food. Ed Conway writes about this in his book Material World. In World War I, Britain had a shortage of binoculars as the lens industry was predominantly based in Germany. Binoculars were needed by artillery men to improve the accuracy of their guns. Conway writes how Britain was able to place an order for binoculars with their enemy Germany, who was desperate for rubber. Britain controlled the supply of rubber.

Armies can run out of not only material but also men. By the end of his campaigns, Napoleon had run through all his veteran fighters and younger and younger boys were being drafted in his armies. The mortality rate for boys born between 1790 and 1795 was 38%!!

Fear of running out of men and material can be a reason for attacking. Another contributor can paradoxically be too much bravery, honor and initiative. Characteristics which are essential for fighting a war.

Elan must. But…

Germany sent many armies into France in the beginning of World War I. They hoped to swiftly annihilate the French armies so their men could dash to their Eastern front to face Russia. The battle near river Marne killed German hopes of a quick victory. The two sides then got into a stalemate of trench warfare. They faced each other in trenches that stretched to the Atlantic sea. Time was against the German side since the allies would outcompete the Germans on men and material. Falkenahyn, the man in charge of German forces, devised a plan to break this stalemate.

Falkenahyn hoped to provoke the French into an immense counterattack at a place of his choosing in Verdun. He hoped that his carefully placed artillery would obliterate the French counterattack. Furthermore, he hoped that the French would keep counter attacking because of the strategic importance of Verdun and prestige. Falkenhayn expected to finish a lot of French reserves in Verdun which would open gaps in French defensive lines elsewhere.

The plan did not work out as Falkenhayn expected. One of the big reasons was that the German generals in charge pushed their infantry to attack way beyond what was the strategic objective. Not only did this result in very high infantry losses for the German side, it also meant that when the French counterattacked, they did it beyond the range of the German artillery. The French also wasted many men in their counterattacks. This happened again and again. In the first five days, the French lost 24,000 men which would have been a success for the Germans except they lost 25,000. Over the entire ten month battle — the longest in history — the Germans lost 337,000 men as against 377,000 French.

This was a battle of attrition and a battle of logistics. ‘At the height of the effort, 6,000 trucks and cars arrived at the terminus every 24 hours, or one every 14 seconds. Discipline was ruthlessly enforced on a no-stops lifeline French called the Voie Sacree — the Holy Road.’

Nolan notes,

‘Falkenhayn wanted one thing: defensive bloodbath by artillery. His generals moved instead like moths to the flame of battle…The side that was better at logistics, won. The French were always going to be better at logistics and Falkenhayn knew that. His general had other ideas.’

Why did the German generals keep overcommitting their infantry? Because that was the German way. Attack was in the ‘fiber of German military thinking’ because it was a strategic necessity for a country that was surrounded by great powers and because it had worked in the past.

Why not defend? Because attack has been a necessity and has worked in the past

Prussia was a Germanic state that was surrounded by great powers. The mighty French on one side, the Russians on the other and the Habsburgs on the South. Prussians wanted to become great powers themselves. For this, they needed to increase the territory and population under their control. The German unification wars were fought with this political aim.The Germans beat the Danes, the Austrians and the French in three wars in a less than ten year period. In each war, the Germans attacked with the aim of winning quick wars. This was so that other great powers did not get the time to intervene. They won, most spectacularly against the Habsburgs, but it is worth examining how much it took to win.

A lot needs to go right for a win including luck

Prussia attacked the Austrio Hungarian empire as it wished to take the German territories of the empire. The Prussian army had many advantages over its opponent and one of the chief ones was that its infantry was armed with Dreyse needle guns. The Austrio Hungarian infantry was armed with Lorenz rifled muskets. The needle guns were breech loading whereas the Lorenz rifles were muzzle loading.

A muzzle loaded gun is loaded with gun powder and ball through the end of the barrel from where the ball would come out. The ball needs to be pushed into the gun, typically using a ram rod. This process takes time as this video shows. Not only is the process slower, but also it requires the soldier to stand up. A breech loader in contrast is loaded from the back of the gun. This process is faster which means that the firing rate is higher. The gun also can be reloaded by soldiers who are prone. This would be a huge advantage for defenders. The range of the needle guns was also superior to the Lorenz rifles.

The needle guns were not a surprise for the Austrian as they had allied with Prussians just a few years ago in Denmark. Austrian officers had seen the superiority of Dreyse needle guns. So why did the Austrian armies not shift to breech loaders?

One reason was that Austria was near bankruptcy and Prussia was booming. Austria did not have the money to invest in new guns for its infantry and it did not have money to spend on the extra ammunition required for training as well as the war. Furthermore, Senior Austrian military officers did not trust their soldiers to not panic and use up all the ammunition very early in the fight, if they were given weapons that had a higher firing rate.

It was not just the Dreyse guns that allowed Prussia to beat Austria. Its mobilization was much better thanks to its investment in the then modern railway and telegraph technologies. Additionally, the Austrian commander was incompetent and chose the worst place to give battle in the battle of Königgrätz. The Austrian officers employed outdated tactics — tactics that had worked when the ranges of infantry weapons were much lower. Because of these tactics, elements of the Austrian army “Fought bravely, even recklessly but mostly uselessly.”

In spite of all these advantages, there was a time in the battle that the Prussians were in serious danger of losing. Partially it was because of Austrian artillery guns which were better. But a big reason was the Prussian need to finish wars fast. The famed commander of their army — Moltke — had attacked early. He hoped that one of his armies still on the march would join in time. Moltke’s second army came in just in time.

To quickly recap — the Prussians had the advantage of better weapons, tactics and leadership and still could have lost. That is the nature of battle. The Prussians had a much tougher time in France a few years later where they won, not in a quick battle but in an attritional siege. They forgot all this and believed that seeking and winning quick battles was the only way to fight war. But that is not all they forgot and this had consequences in the wars that followed.

They forgot that perhaps the biggest contribution to the unification war was not even in the war but in diplomacy and politics. Bismarck’s isolation of Habsburgs before the war helped ensure that no major power intervened in the war. His diplomacy after the war was even more important.

‘He blocked excessive demand by a usually cautious King Wilhelm I, who was suddenly avaricious for annexations. Bismarck insisted on no annexations of Austrian provinces, for that was likely to provoke France and Russia. Instead, he moderated the armistice to dissuade other powers from propping up Austria or trying to reverse the meaning within Germany of the decision won at Königgrätz.’

A country that keeps winning is very likely to create a coalition of embittered losers and fearful potential rivals. Eventually a large coalition will beat you with men and material even if you are a genius at waging war. A country using war as an instrument of politics should be clear about what its political goals are. In other words, do you know why you are fighting and when you have had enough?

A question that Napoleon never asked, it seems.

What did the “God of war” leave behind?

Clasuwitch, the famous German war theoretician, called Napoleon the God of war. Napoleon won countless battles. He was very gifted at tactical and operational level. His armies would routinely catch their enemies by surprise because of Napoleon’s genius at understanding the terrain, his enemies and at getting his armies to maneuver to be at the right time at the right place. Napoleon became the emperor in 1804. At his peak Napoleon ‘was the master of Europe from the Vistula to the channel’. But in a few short years, he had been exiled to the remote island of Saint Helena in 1815. Why did the “God of War” and master of half of Europe end up as a prisoner on an island?

Clearly there were many factors that led to Napoleon’s downfall. The initial advantage that France had of levee en masse or conscription, which gave it huge armies, was copied by others. His enemies understood and countered his battlefield tactics. As time passed, Napoleon lost more and more of his veteran fighters. Britain’s sea blockade made a difference as did its twenty three year financing of Napoleon’s enemies. Napoleon’s campaigns in Russia and Spain dealt severe blows to his armies and his reputation for invincibility. And then all his enemies attacked him together. All these reasons are true and historians would doubtlessly point out many more that I have missed. But underlying these reasons is the main problem.

Napoleon did not wage war because he was trying to achieve an underlying political aim. He waged war for la glorie. It was one war after another as he could never get enough glory. He went into Russia without consolidating his victories in Spain and he had to pull out many of his veterans from Spain to accompany him in Russia. In Russia, when the enemy kept refusing him battle, he kept chasing them for hundreds of miles even as his supply lines stretched thinner and thinner and his men died of disease. His refusal to negotiate and his tendency to break treaties whenever he did enter them meant that all his enemies allied against him. Napoleon lost because he kept chasing the glory of winning the next battle. As Nolan said,

‘He should have been content to rule in peace. He never was.’

What wins wars and can we predict who will win?

Let us summarize what we have learnt

  • It is not easy to determine who is the winner in a battle.
  • The winner of a battle is not necessarily the winner in a war. Winning battles may tempt countries to fight even more battles.
  • If a war becomes attritional, as it often does, then the country that can provide more men and material will prevail most of the time.
  • War time logistics is an immense task. The country would need not only food and fuel but also other critical material. In today’s complex world, the list of such material could be very long. The manufacturing capacity of a country and its self reliance could be key.
  • Defense is easier than offense. Countries may choose to attack instead of defending in order to achieve their political aims. Or they may do it because blockades are choking the supply of vital material. Or they may do it because of a culture of honor.
  • Clarity of politics behind battles is extremely important. This clarity would help a country to know when to stop and to reduce the strength of coalitions against you.

War is complex. Predicting what will happen in a war between matched opponents is not easy. Being confident of those predictions is downright foolish. Recent events in Ukraine have demonstrated this again. Repeated predictions of an early Ukrainian (or Russian) victory by experts have not come true. It may be better to listen to cautious voices like that of Gray Connelly, who has been emphasizing the importance of the Russian capacity to generate men and material right from the beginning.

We cannot be sure what will happen in a war. Except that there would be death. If there is a war, there will be death.

War and death

The impression I got reading The Allure of Battle is that Nolan is antiwar but is pessimistic that humanity can avoid wars for long periods of time. The book has evocative passages throughout about the horrors that wars visit on us. I end with a particularly powerful passage.

‘What met a generation of schoolboys raised on heroic stories of Marlborough, Frederick and Napoleon was not glory but hard death in ways old and new. Cold death from a sniper while tangled and frantic on jags of barbed wire invented by far off ranchers to hem in cattle. Hot death as liquid flame gushed over a man to light him up like a Roman candle. Slick greasy death as a sawtooth bayonet snicked easily into a gut. Gurgling death, throat ripped out or a jaw torn away by a machine-gun bullet, unable to cry for aid. Lonely death at the bottom of a shallow crater filled with yellow rainwater and piss, and bits of horse and human flesh upturned and minced by the last bombardment. Instant death as a boy turned into a mush of pink pulp and red mist when a high-explosive shell landed a foot away, one drop in a steel rain that fell for days and night on end. Fumbling death from Mustard gas or worse, much worse chemicals as the war went on. So much death that tens of millions gagged down every meal inside a sweet-sick order of putrefying horse and human flesh.’

Liked what you read? Follow me on medium and choose the option to get the stories delivered to your Inbox.

You can follow AskHow India (@AskHowIndia) or me (@YogeshUpadh) on twitter or on LinkedIn

Telegram channel: t.me/YogeshUpadhyaya

0

What some of us Engineering types don’t getfeatured

November 20, 2023

I spent four years at an engineering college. My tribe likes to rely on facts, data and rationality to understand the world and make decisions in it. We have internalized the motto of the Royal society — Nullius in verba or “take nobody’s word for it”. For me, this meant ignoring all that which cannot be quantified. I now think that is a mistake. There are many things in the world that cannot be easily defined, let alone quantified. Yet, they have critical influence on our behavior as well as that of the world around us. One of these things is status — possibly the least appreciated important concept by people like me.

What do I mean by status? Look at the image below. Who according to you has the higher status?

It is very likely that you chose Mahindra Singh Dhoni (in Yellow) and not Hardik Pandya. We cannot see them move or hear them speak and yet, all of us can read their body language. Google Pandya Dhoni and then click on Images. Every picture tells the same story.

Or does it? Is it possible that we know that Dhoni is older and more accomplished and hence we know that he has higher status? In other words, are we seeing what we already know?

Try this the next time you are in a restaurant with a friend. Each of you should rank people on other tables in terms of status. Don’t define what status is. Don’t discuss it. Just look at each table and rank every person there. When you are done, compare your rankings. I would bet that they are very close. Is it not astonishing that you are able to come to very similar rankings about people you don’t know, just by observing their body language?

I teach Improv theater and status is a key part of what I teach. To do this, I use exercises from the great book, Impro by Keith Jhonstone. The most foundational of these exercises is the Emperor game. One participant sits in the middle and is the emperor. The other participants are his (or her) servants and subjects. They approach the emperor and interact with him. Any time the emperor feels disrespected, irritated or displeased in any way, he snaps his fingers and the offending participants ‘dies.’ The ‘subjects’ can make multiple attempts.

Almost always, the exercise follows a pattern. The emperors need a little bit of initial encouragement but soon start snapping their fingers quickly in their interactions. Sometimes even before their servant has said a word! Many times the emperor’s servants do not understand why they are getting killed. They get annoyed that their fellow participant is ‘killing them off for no reason.’ This irritation lasts till they become emperor and then they merrily snap away. Most importantly, once the participants get the game — and everyone gets it pretty quickly — there is a lot of laughter. The session has a lot of energy and afterwards people have a lot to say about it. They intuitively understand the difference between a very high and a very low status even though in real life we rarely encounter such large differences.

I have been careful not to define status. This is because an analytical definition would only distort the intuitive understanding you would have when you try or even imagine trying the exercises that I have described above (you could look at some of the clips here to see Status in popular culture). That said, it will be useful to clarify what status is not.

Is what I am calling status simply confidence? Confidence is certainly a part of high status. It is impossible to lack confidence and have a high status. However, someone can be very confident and still be low status relative to another person. For an easy to understand example, let us go back to Dhoni and Pandya. Pandya, a young superstar is supremely confident but still lower status to the venerable captain with two World Cups and many many IPL titles. Here is another image.

Let us look at another concept that could be confused with status — ego. How is ego related to status? When in an interaction, we feel that we are not given our due status, our ego is hurt. Think of how you would feel if you believe that the waiter in a restaurant is rude to you. I carry such episodes in my mind for years! But why would I feel that the other person owed me respect? It is because I believed that in that interaction, I had a higher status or at least did not have a lower status. Both confidence and ego are internal to an individual. Status is what happens in an interaction between two or more people.

Note that status in the sense I am talking about could sometimes be different from social status. A timid low status boss with a dominating subordinate is a great comedic situation.

One reaction I get in my Improv classes is that status is purely a human social construct. This is a good time to take a detour into the animal world.

The complex and ruthless politics of Chimpanzees

I cannot recommend the book Chimpanzee Politics by Franz De Waal enough. The author and his group observed the chimpanzee colony in the Arnhem zoo for many years. The book is a gripping account of what they saw.

I have read the book twice and each time I was struck by how much the description of chimpanzee life reminded me of us humans. The author describes chimpanzee children role playing as adults, chimpanzees throwing a tantrum when they don’t get what they wish for and how they hold out their hands when begging for help. The biggest similarity, given the topic of the book, is in status. How ritual greetings, including deep bows and kissing of feet, formalize status. How status is as much given as it is earned. Above all, how much the chimpanzees risk for status — sometimes even their lives. Clearly, the desire for status in humans does not come solely from social conditioning.

I must note that the above is a description of what is a chimpanzee society in a zoo and not what I am prescribing should be in human society. In any case, status works differently in different species. In rhesus monkeys for example, the status hierarchies are much more rigid and much more brutally enforced. Human societies are much more complex and as can be expected, status roles are complex too.

Of course, humans are different…

The way status works in humans and chimpanzees is different in at least two ways. First, status in humans can be about competence and not only about power.

Competence based hierarchy and status changes

Look at this video on mute for a minute or two. This is a discussion between two academics and as far as I know neither has any power over the other. Who do you think has the higher status? While both of them are very accomplished, David Deutsch is much more famous. In academic circles, his reputation would dwarf that of Hanson and in my opinion it shows in the video.

Humans can have higher or relative lower status based on specific competencies in specific situations. Imagine this scenario. The CEO of a large corporation has gone to the Himalayas for a vacation. He gets trapped because landslides have closed off roads. An army truck pulls up to his hotel to rescue him. We can bet that in an interaction between the CEO and the army jawan, the jawan would have a higher status. This is because, in the situation they are in, the CEO is scared and the jawan’s competency is much higher. The situation would probably reverse if the jawan goes to work in the CEO’s company after his retirement from the army.

Another big difference between humans and animals is that we move across many groups. And our status may be different in different ones.

Status shifting across group

Imagine a professor in an engineering institute. She has a high status in her class when she is teaching. Without that she is unlikely to be effective. When she meets parents of her children’s classmates, her status may not be as high. This could be because, given her responsibilities, she is unable to devote as much time to school activities as the other parents.

Different status in different groups is very normal for us humans. Most social animals — and the concept of status makes sense only for social animals — don’t have too much interaction outside their own tribe so they don’t have this issue.

Perhaps, I have convinced you that status exists and it is not entirely a social construct. Why should we care?

Why should you care?

Seth Godin is a marketing guru. Seth believes that status is a very important concept. So much so that Seth devoted the second episode of his podcast to status roles. This episode, Seth writes in his blog, is ‘the result of perhaps fifty blog posts I wrote but didn’t post’.

Seth makes some very interesting assertions about status.

‘Status Roles inform every decision we make’.

Also,

‘Just about everything you see in theater or movie theater or read in a novel is about status’

Status is infused in human life. The first practical application of status that I want to talk about is in the art of persuasion.

When you persuade people

My first job was as a consultant. Our organization grew very rapidly and in my first year itself I found myself leading assignments where we were advising very senior government officers. Convincing them of the correctness of what we were saying was very difficult but I think it would have been easier if I were as aware of status as I am now.

In a particularly indicative episode, a client of ours pulled us aside and asked us to come to their office in a car rather than in an autorickshaw. Our client was convinced that our arrival in an autorickshaw reduced our status in the eyes of their employees and hence our effectiveness. Of course, status is not just about such external markers. Behavior and body language may be much more important. If the consultant is too deferential towards a client, she will not be too convincing. Unfortunately, this happens way too often.

Many young people get intimidated by the status of the person listening to them. Meetings are in the office of the client where he is very comfortable. The client’s subordinates are deferential to him. All these factors create a sense of low status in the presenter and they are not even aware of it. Their chest narrows, they cross their arms, they stoop a little and they talk faster. Unfortunately, their words have stopped mattering.

The opposite behavior, that is cockiness or extra aggressiveness may be better than timid behavior but that has limitations too. A consulting company I worked with as a trainer, encouraged their consultants to be ultra aggressive because they felt that this was the fastest way of removing their timidity. This is better than being meek but is not the optimal solution. If you trample all over the status of a senior person, it is unlikely they would be persuaded even if what you’re saying is logical. Especially, if this interaction is in front of that person’s subordinates. It would take a lot of maturity for them to overcome this public lowering of status. A skillful persuader would take his status just below or just above that of their client.

I have dived deep into the consulting world but persuasion is part of almost every job. Sales is about persuasion. A lawyer persuades a judge. A startup founder is persuading potential clients, potential investors, potential employees and in India even potential employees’ parents!

Being aware of status is useful in personal situations too. For example, when offering advice to friends. People may not accept much needed good advice. This is how Scott Adams explains the challenge in his book ‘Reframe your Brain’.

“Given my flawed character, if you were to offer me advice, I might respond in a defensive way…it will make me feel dumb for not solving the problem on my own. I might feel as if I moved down a rung on the social ranking.” (Emphasis mine).

I am sure I act the same if offered advice. When I have offered what I have felt is much needed advice, I have seen people become defensive. Especially if those people are my contemporaries. So what do we do when we feel that we have something really helpful to say to someone else? Here is Scott with a possible solution,

“Instead of advice, suppose you asked me if I’m aware of a new study that could change my decision…. I would see your mention of the study as helpful…Later I will feel as if I made my own decision, perhaps influenced by what you told me”.

Note that Scott’s advice helps preserve the status between the advice giver and receiver. Other ways of achieving the same could be to use communication like, “What other people have done in situations like yours…”. Of course, in this communication it is not only the words but the way they are said that is important.

We should be aware of status when persuading people. We should also be aware that others are using status in persuading us.

When people persuade you

Seth asks us to be aware that our desire for status can be used against us by people selling us products or ideas. As a receiver of communication, you need to be aware of how others may be using status to change your mind. The extreme example of this is luxury goods.

In a blog post Seth decodes the psychology behind luxury goods.

‘A luxury good gets its value from its lack of utility and value. A typical consumer would look at what it costs and what it does and say, “that’s ridiculous” … .The value, ironically, comes from its lack of value.’

Almost the whole purpose of a luxury good is to raise the status of its owner. A Birkin bag may carry things, a Cartier watch may tell time and a Monet original may look nice, but that is not their point. If you are arguing about the worth of a Cy Twombly painting and not considering status as one of the main reasons that the painting fetched sellers tens of millions, then you are missing the point.

Of course, we can never be fully free from the lure of Status. It is possible or even likely that you are the kind of person who would never buy a Twombly and your car is not the most expensive one you could afford and your clothes are made in India and not in Italy. But it is likely that your sense of status comes from being ‘sensible and rational’. Programming by Millions of years of evolution can be beaten by very few. The rest of us are doomed to chasing status one way or another. But yes, without a Twombly, we can be slightly more financially secure while doing it.

Whether it is sellers of goods or services or political campaigns, people are using status to change our minds. In addition to being aware of this fact, we can accept another sound advice from Seth — to let go of perceived status violations, especially when nothing material has been taken from us.

It rankles

In his book Impro, Keith Jhonstone talks about a small encounter he had a long time ago. He was exiting a cafe and another man was entering it. The two of them did the dance of stepping aside but in the same direction a few times till the other man caught Keith by his shoulders, fixed him in a place, and walked around him. Keith reported that the incident rankled even after many years. I can understand that.

I carry a big bag of slights from the past. Some of them were intended and others not. Some of them are real and others probably imaginary. Seth Godin has the very sane yet difficult to implement advice of ignoring all attacks on our status unless they are being used to get something material from us. This is especially useful advice in this age of social media.

A friend of mine makes funny Instagram reels. As his reels started getting popular, he noticed many negative and even abusive comments. Once, on a whim, he went to the profile of the abusers and found out that most of them were other creators of funny reels, only they were not as successful as him! Those creators were probably trying to enhance their status in their own minds by posting negative comments. Most insults are ways of increasing status. I confess that while intellectually understanding this, I am unable to shrug them off. The best I am able to do is to admit that I am being silly.

It is just not Instagram creators and Improv teachers with thin skins who could take status violations seriously. It is possible that world leaders and entire populations do that too with far more serious consequences.

Obama versus Putin

In his book The New Map, Daniel Yergin has this to say in the context of Russia US relationship.

‘…when Obama appeared to have been seated in a kiddie chair, while Putin lectured him about the “errors” the United States had made in its dealings with Russia. In August 2013, after Snowden’s defection, Obama had reciprocated, saying Putin’s “got that kind of slouch, looking like the bored kid in the back of the classroom.”

Who is to say what kind of role these insults played in precipitating the current US Russia conflict in Ukraine? Sure, we can point to many logical reasons from each side. For example the Russian side may say that it is threatened by expansion of NATO and the US / European side may say that this is a conflict of values between democracies and dictatorships. However, there is no doubt that many ‘inevitable’ conflicts in history have been avoided because leaders could find a way of working together. When leaders insult each other, working together is difficult. If you remember your Mahabharat, you would recall that diplomacy just before the war could not work and part of the problem was the burden of insults on both sides.

Unlike wealth in a growing economy, status is a zero sum game. I buy something you sell and both of us win. If I have a higher status than you then by definition, you have a lower status. Like in the Chimpanzee world, many conflicts in the world are because of the fight over this zero sum resource — fights for status not just between individuals but between groups. Societies can carry grudges for decades and centuries.

There used to be a thinking prevalent that poverty is the cause of terrorism. However, it is very rare to see desperate fighters come from the most impoverished parts of the world. Most acts of terror are committed by people whose bellies are full and who feel they do not get their due respect. A much more healthy expression of this need is when you see people cheering for their sport teams with fervor. They do that because they expect a status boost when their side wins.

At this point, people from my tribe may ask ‘What proportion of such conflicts are caused by long term interests of nations and what proportion caused by status violations of leaders and people?’ Unfortunately for us, this is an unanswerable question. These kinds of unanswerable questions are everywhere in social sciences, especially Economics. This reality frustrates the efforts of practitioners who wish to make Economics like Physics.

Incentives = Money?

Incentives come up often in discussions on economics or public policy . Unfortunately, in most of the popular discourse, incentives almost always mean money. In this understanding, people do things because they get money for doing those things. However, non monetary incentives are very powerful and status is one of the biggest ones. Let us take some examples.

Why do some soldiers risk their lives for their country? Sure, they consider it their duty. Sure they love their country. Sure it is a matter of honor. However, if society does not give them status, all of the other incentives would become weaker.

Why do successful sports persons keep playing even when everyone else can see that their best days are behind them? Most people think it is because they are greedy for money. I posit that they can see that their status will drop rapidly when they retire and they dread it. Money is important but the bigger reward is status.

This is true for almost all professions. The most successful people in them work disproportionately hard. Almost always, status is their biggest reward. In fact, after a very early point, money is most important as a measure of status. The bonus of an Investment Banker is at least as much about status as it is about the money. This reminds me of a funny but not really funny episode of my life.

Many years ago, I co founded a software product company. In the initial years, we had the practice of a bi-yearly performance evaluation linked to a bonus for all employees. I cannot convey to you how much distress this practice caused. We have had young men and women sit in front of us with tears streaming down their face because their bonus was less than that of their colleague. A very capable young guy, five months out of college, cried in front of us for nearly twenty minutes, because he was paid a bonus of Rs. 17,000 and his classmate was paid Rs. 18,000! So much distress and all because we founders believed that Incentives = Money!

Unfortunately, status — and all emotion related rewards — are impossible to measure. Economists love money because it is measurable. If I have 100 Rupees and you have a thousand then who has more money and how much more? Very easy question to answer. Between Nandan Nilekeni and Mark Zuckerberg, who would have the higher status and by how much? Impossible to answer this question. This inability to measure is very unnerving for people. Once we add non quantifiable emotions to a ‘logical’ discussion, then what is the difference between economists and literature majors?

Is the desire for Status just another desire?

All right, money is not the only incentive. A desire for status also motivates many people. Conceptually, how is this different from other desires such as desire to survive or desire for love or sex? First of all, let me agree that some people can overemphasize status. To those people I would recommend another book from Franz De Wal — Good Natured. But since, this is an article on status, let me quickly examine how it is different from other desires. One big difference is that many people plain reject that this is real.

When I take my Improv students through status exercises, I get two types of reactions. Some people say, ‘Oh, an entirely new world has been revealed to me!’ Others say, ‘This is Bull Shit. Status is not real.’

Curiously enough, both reactions rest on a demonstrably false foundation. If status is not real OR if it is entirely new to us, how come the participants understand it so quickly? How come there is so much instinctive laughter even when nothing funny is being said? I think it is a case of fish finding out about water for the first time in their life. When I point this out to the skeptics, they are not necessarily convinced. I think it is because of an erroneous, although laudable, belief.

We have a deep seated desire for fairness. I believe that most of us are born with it. Add to it the constant exhortations of society and we believe that fairness is core to being a good person. (I believe that these societal exhortations have actually been useful in reducing many of the gross inequalities in the world). So, many of us reject hierarchies, or at least their importance, not because they are not there but because we wish they were not there.

Thus, you have romantic movies that speak to our desire for love and adventure movies that address our need for survival. There are no movies about our need for status. Except sports movies — afterall the winner with her hands aloft at the podium is the ultimate symbol of status. Or action movies in which the hero defeats villains of a much higher status. Or comedies in which status change is often what makes you laugh. Or a tragedy where a noble leader of a wolf pack bows to age or circumstances, but without whining.

Seth Godin is right, Status is baked into a ‘Just about everything you see in theater or movie theater or read in a novel’. It is the water we are swimming in and my tribe would do well to recognise that.

__________________

I have tried to simplify a very complex topic and hence have left out a lot! For a deeper dive, do read the books referenced in this post and more importantly, see the world with this lens.

Edit: Thanks Sunay and Sophie for spotting typo.

__________________

If you wish to stay in touch with my writing, follow me on medium and get your stories delivered to your Inbox.

You can follow AskHow India (@AskHowIndia) or me (@YogeshUpadh) on twitter or on LinkedIn

Telegram channel: t.me/YogeshUpadhyaya

Author –

Yogesh Upadhyaya

(Yogesh Upadhyaya is one of the founders of AskHow India. Blogs are personal views.)

0

Importance of Petroleum for Russia’s international relationshipsfeatured

September 30, 2023

Petroleum is very important for Russia and its place in the world. Of course, there is a lot to Russia other than Oil. Russia was the country that beat back Hitler’s armies in the second world war. It is also the first country to send a man to space. And it is still the country with the largest nuclear arsenal in the world. That said, it is impossible to understand Russia’s relationships in today’s world unless we understand its position in the energy world. In this post, I will look at Russia’s relationship with Saudi Arabia, Europe and China. Let us begin with understanding the Russian Hydrocarbon sector.

Image by Wilfried Pohnke from Pixabay

Russia’s Energy Might

Russia is the third largest producer of crude oil, just behind Saudi Arabia and not too far from the US. It is also the second largest producer and exporter of Natural Gas behind the United States. Interestingly, most of Russia’s gas exports are by pipeline. This is important because pipelines reduce the cost of transport significantly.

Russia has long been a significant producer of Hydrocarbons. However, the production in the country suffered when the USSR disintegrated. It recovered but then the world wide demand fell due to the Asian financial crisis. In this century, the crude oil production in the country has increased steadily until the demand fall caused by the Coronavirus crisis. The first decade of the Twentieth century was very good for prices. On the back of increased production and prices, the oil exports increased from $ 36 Billion to $ 284 Billion between 2000 and 2012. The gas exports increased from $ 17 Billion to $ 67 Billion.

This money has been critical for the country and has strengthened it militarily, economically and socially. As Daniel Yergin says in The New Map,

“As the oil and gas revenues mounted, Russia went from economic weakness to strength, paying off international debt, raising wages and living standards, increasing pensions, saving money in stabilization funds, spending more on defense and financing its restoration as a great power.”

The increase in Russian exports together with the US production boom due to the Shale Revolution has changed the energy world. In Yergin’s words, the world moved from an OPEC /non Opec paradigm to a Big Three paradigm with Saudi Arabia being the third.

This has changed how Russia and Saudi Arabia relate to each other.

Russia and Saudi Arabia — Frenemies

Russia and Saudi are the two biggest exporters in the Hydrocarbon world and hence competitors. The erstwhile Soviet Union had a big role to play in the formation of the Organisation of Petroleum Exporting Countries (OPEC) where Saudi Arabia is a leader. The surging volumes of Soviet oil caused the oil prices to fall. Enraged at a reduction in their revenues, Saudi Arabia and Venezuela led other exporting countries to form OPEC. In the past, OPEC countries have agreed to production cuts multiple times to stabilize or increase oil prices. However, now with Russia’s position in the Big Three, no price fixing can happen unless both it and Saudi Arabia are on board. Hence, they have to cooperate at times of low oil prices and this has happened twice in recent years.

In 2014 crude prices started falling after being more than $100 per barrel for many years. Price fall is a concern for oil producing countries because their economies and government finances depend a lot on oil revenues. Saudi Arabia realized that it was no longer possible for OPEC to stabilize prices by cutting production. If they cut production, the volumes would shift to non OPEC producers. An attempt was made by Saudi Arabia, Russia and Mexico to arrive at a deal, but it did not work out. The prices kept falling.

In September 2016, President Putin of Russia and the then deputy crown prince Mohammad Bin Salman of Saudi Arabia had a meeting. They agreed that no stable oil policy can be followed without the involvement of Russia and Saudi Arabia. Later in the year, OPEC and some non OPEC countries agreed to a production cut of 1.2 million barrels per day. The arrangement has been called OPEC-Plus or the Vienna Alliance.

In 2020 Coronavirus hit all economies of the world and oil prices fell sharply. There was an attempt to reach a deal to cut production but the attempt failed. Miffed, the Saudis announced that they would increase their production from 9.7 to 12.3 million barrels per day. Over a period of time, the prices reached $14 per barrel. The US, under President Donald Trump, got all OPEC-plus producers to agree to a steep production cut of 9.7 million barrels. Russia and Saudi Arabia would contribute 2.5 million barrels each to this cut.

Russia has carved a significant role for itself in the wider Middle East and the oil revenues help. For example, Russian assistance was a big reason that the Syrian President Bashar Al-Assad could crush all his opposition. Russia is also one of the few powers that can talk to almost anyone in the Middle East. However, a detailed discussion of Russian actions in the Middle East is beyond the scope of this post.

Let us look at the Russian European relationship next.

Russia and Europe: Can’t live with you or without you

The last many decades of relative peace have caused some of us to forget the bloody history of Europe. The great powers on the continent have fought ferocious wars for centuries and suffered immense death and destruction. In recent decades, the continent has hoped that increased commerce between great powers would reduce the risk of war. However, increased dependence, especially for something as vital as energy also means that you can become very vulnerable when conflict does happen. This is the backdrop of the relationship between Russia and Europe.

In 2021, Europe imported more than 90% of its crude and petroleum product requirements. The biggest imports were from Russia.

https://ec.europa.eu/eurostat/

Russia also supplied 35% of the Natural Gas requirements of Europe. This supply was through a set of pipelines. The cost of transportation by pipes is much lower than the alternate method of liquifying the gas, transportation by tankers and then re-gassifying it. This cheaper pipeline gas was attractive for both industries and households. The pipelines have also been the cause of disputes for a few years now.

In 2005, more than 85% of gas sold by Russia to Europe were through pipelines that passed through Ukraine. Ukraine got gas for its own use from this pipeline and also charged transit fees. This arrangement worked when both Russia and Ukraine were part of the Soviet Union. However, bickering started when Ukraine became independent. According to Russia, the price paid by Ukraine for its own use gas was way below market price. Furthermore, Ukraine did not regularly pay its bills even at these concessional rates. When Russia tried to cut supplies in retaliation, Ukraine simply took the gas it needed from the pipeline. This meant that Russia’s other European customers faced shortfalls.

Russia and Ukraine settled their gas related disputes in December 2019. Russia guaranteed five years of volumes to Europe, which would have guaranteed transit revenues to Ukraine. The Russians also agreed to settle a $ 3 Billion arbitration claim of Ukraine. Unfortunately, disputes about Natural Gas were only a part of the problem between the two countries. As we know, war broke out between the two countries in 2022.

Russia has made other pipelines to Europe. Yamal-Europe through Poland and Blue Stream that runs under the Black Sea to Turkey. However, from a Russian point of view, both pipelines have the same problem — they pass through third party countries that can raise their transit charges and cut into Russian profits. The Nord Stream pipelines were supposed to remove this vulnerability for Russia. The Nord Stream pipelines are a pair of pipelines that run under the Baltic Sea directly from Russia to Germany.

The US has long opposed these pipelines. The US felt Germany especially was becoming too dependent on Russia. President Trump went as far as to say, “Germany is a captive of Russia.” The US imposed sanctions that made it difficult for the second pipeline to come up. Germany wanted to go ahead with the pipelines, tempted perhaps by assured gas supply at competitive rates. The Germans also hoped that commercial ties between Russia and Europe would increase the incentives for peace. All this has not worked out well. The Russian-Ukraine war has pitted Europe (and US) against Russia. Russia throttled the supply of gas to Germany many times. It claimed that it was for maintenance. In September 2022, both the pipelines were destroyed. Both Russia and the US have been accused of destroying the pipelines.

Not all Europeans have been enthusiastic about their dependence on Russia. Eastern Europeans especially were wary. Lithuania opened a LNG regasification terminal in 2014. The terminal is called ‘independence’. Poland opened a much bigger terminal a year later.

Incidentally, the risks of European dependence on Russian gas have been discussed for decades. As far back as in early 1980s, Americans feared the influence of Soviet Gas on the European US alliance. As Yergin says,

‘Washington also feared the dependence on Russian gas, especially in Germany, could help Moscow generate fissures in NATO and provide a major pressure point if East-West tensions worsened.’

Since the war began in Ukraine, energy prices in Europe have risen sharply. Europe is relying more on LNG. Volumes for Russia have been replaced for both crude oil and Natural Gas. Seaborne Russian crude oil is banned from entering the EU. China and India have increased their imports of Russian crude. EU imports from the US and the Middle east have increased. This rerouting would increase the global costs of transporting Hydrocarbons. The higher energy prices have impacted industries. It has also taken the energy bills of households up although in many cases they have been subsidized by the country governments.

It is worth noting that the US and Europe have not attempted to totally shut down the exports of Russian Oil and Gas. At least to me, it seems that all they have achieved is some rerouting. Europe knows that they and the world cannot live without Russian Hydrocarbons even as they see thousands of people die in a war on their doorstep.

Europe is wary of Russia. On the other side of Russia is China and the relationship between the two has none of this wariness. Hydrocarbons are one very strong pillar of their relationship.

China and Russia — BFFs

China’s growth has been astonishing for the last few decades. This growth has required fuel. While China gets most of its energy from domestic coal, it has had to import petroleum and natural gas. It has imported these from all over the world.

https://www.statista.com/statistics/1310953/oil-imports-by-country-china/
https://www.eia.gov/todayinenergy/detail.php?id=52258

For a long time, China has worried about what it calls its ‘Malacca dilemma’. A very large portion of China’s imports come from the Persian gulf, and the sea route through the Strait of Malacca is the shortest route for this cargo. China has long believed that this cargo is vulnerable to blockade by the powerful US navy. Imports from Russia and Central Asian Republics either by the Atlantic route or by pipelines reduces this vulnerability.

The Russian-Chinese collaboration in Hydrocarbons was significant even before the current Russia-Ukraine war and one impetus came in 2014. The two countries had negotiated a gas deal for nearly a decade til 2013. The sticking point was price. The Russians wanted the price linked to oil prices as was the case in their contracts with Europe. Beijing wanted prices to be competitive with coal. China has strived to keep the cost of its manufacturing low and energy costs are important for the country.

In 2014 Russia annexed Crimea and was subsequently slapped with sanctions and the negotiations became urgent. Russia and China announced a $400 Billion USD thirty year deal. The Chinese also promised to provide a $45 Billion financing for a thirteen hundred Mile “Power of Serbia” pipeline. This is not the only major Chinese investment in the Russian Hydrocarbon sector.

The Yamal peninsula is just 300 miles from the North Pole. The conditions there are so harsh that it was believed that it was not possible to extract Hydrocarbons from the region. An independent Russian company, Novatek, did not share this belief. It went ahead with a plan that required a very large amount of investments. 30 Billion Dollars were required to develop the new city of Sabetta. 15 new ice breaking tankers were required, each costing $320 million. The challenges for the project increased sharply when Ukraine related sanctions hit Russia in 2014. Till then Russia had been reluctant to take Chinese investments in their upstream assets but after the sanctions they had no choice. The project took a $12 billion loan from Chinese lenders. The Yamal LNG terminal is now an important supply source for China as the shipments from Yamal do not have to go through the Malacca strait.

A lot of China’s Hydrocarbon imports are from Central Asian Republics. Turkmenistan, Kazakhstan and Uzbekistan are all major Chinese Hydrocarbon suppliers. They are also pipeline partners. China not only buys from these countries but also invests in them. It has had to deal with these countries with the utmost sensitivity. Russia considers them under its own sphere of influence and has been very prickly about what it considers interference from other powers.

In the 1990s, the US pushed hard to build infrastructure to evacuate Hydrocarbons from the Central Asian Republicans. Many in Russia believed that the US was doing this to weaken Russia. The US believed that oil revenues would help build the newly independent countries. It would also reduce the risk of supplies from the Middle East. This is what the Vice President Al Gore, who was leading the US effort, had to say.

“The security of the world’s oil and natural gas resources continues to be the highest interest of the United States and its allies. Today, the boundaries of the region over which U.S. interests are concentrated expanded to the Caucasus, Kazakhstan, and Siberia.

Russia was unable to prevent the building of the pipelines and resented it. China has been sensitive to this resentment. It is to the credit of the leadership of China as well as the central Asian republics that as of now they have been able to manage the Russian sensitivities.

The Chinese-Russian relationship has many elements. However, there is no doubt that Hydrocarbons are at least one reason why in 2018, President Xi said, “President Putin is the leader of a great country who is influential around the world. He is my best, most intimate friend.” This was when he gave Mr. Putin a “friendship medal” which looks like a large gold necklace.

Summary

Russia is one of the Big Three of the Petroleum world. This position is crucial to understanding its relationships in the world. The Hydrocarbon revenues help it become strong militarily and economically. Hydrocarbons are also central to these three key relationships.

  • Russia and Saudi Arabia compete as the two biggest suppliers in the Hydrocarbon world. They also cooperate in tough economic times when oil prices fall too much.
  • Russia is the closest Hydrocarbon supplier for Europe. However, Europe and Russia have a complex history and Europe is wary of depending too much on Russia. Europe is also unable to stop Russia from being a supplier to the rest of the world.
  • Russia’s other big neighbor is China and the energy thirsty country has an excellent relationship with Russia. China gets Hydrocarbons not only from Russia, but also from Central Asian Republics, which Russia considers in its sphere of influence.

Edddit: The price of icebreakers corrected. 320 million and not 320 billion. Thanks Praneet for the alert.

If you wish to stay in touch with my writing, follow me on medium and get your stories delivered to your Inbox.

You can follow AskHow India (@AskHowIndia) or me (@YogeshUpadh) on twitter or on LinkedIn

Telegram channel: t.me/YogeshUpadhyaya

Author –

Yogesh Upadhyaya

(Yogesh Upadhyaya is one of the founders of AskHow India. Blogs are personal views.)

0

How the Shale Revolution is changing the US and the worldfeatured

August 28, 2023

The Shale Revolution is one of the biggest economic, environmental and geostrategic events of the last two decades. Shale oil and gas have changed the energy map of the United States and hence, the world. If you, like me, are not aware of the extent of change it has brought, this short article is for you. The article draws a lot from the excellent first section of “The New Map” by Daniel Yergin.

Representational Image by Tobias Lindner from Pixabay

The shale revolution was launched by two technological breakthroughs. These breakthroughs allowed the United States to solve a big problem faced by its Oil and Natural Gas Industry. Oil and Natural Gas are formed when dead organisms are subjected to pressure. The organic matter is pressed in dense rock for millions of years. The oil and gas that gets ‘cooked’ in this dense rock, then migrates to reservoirs from where it is profitably extracted. It was generally believed that there was no way to extract the Oil and Natural Gas trapped in the rock itself. Innovations in two technologies changed this for natural gas.

Hydraulic Fracking (commonly fracking) involves injecting a cocktail of water, sand, gel and some chemicals under high pressure into rocks that breaks open the small pores so that the gas is released. The technique has been around for conventional oil wells since 1940 but it had never been used to recover gas from shale. In 1998, it was successfully used for shale gas. The other crucial technology in the shale revolution was horizontal drilling. Advances in measurement, directional drilling, seismic analysis, etc. allowed horizontal drilling to be carried out for much longer distances than before. In just a few years, these techniques were applied to Oil drilling too. Together they changed the energy landscape of the US.

By 2019, the estimates for recoverable NG in the US had become thrice the estimate in 2002. Companies that used to think in terms of billion cubic feet (bcf) of gas started thinking in terms of trillion cubic feet (tcf). From a position where it was contemplating LNG imports, the US became an exporter. The change in crude oil was no less dramatic. By 2014, the state of Texas was producing more oil than any OPEC country except Saudi Arabia and Iraq. One area — Spraberry and Wolfcamp — was deemed to be the second largest oil field in the world behind Ghawar, the supergiant Saudi field. The net US oil imports came down from 60% in 2008 to 3% in 2019.

Shale Natural Gas changed the electricity sector in the US. In the 1990s before shale, Natural Gas accounted for less than 22% of electricity generation in the US. As late as 2007, coal generated nearly half of US electricity. By 2021, coal was down to 19% and Natural Gas was up to 39% as this chart from Statista shows.

Note that NG based power plants also helped increase the share of intermittent renewable sources — wind and solar — from 8% to 23% over the same period. This is because gas turbines are best suited to compensate for the abrupt increase and decrease in generation from solar and wind.

The prices of energy fell and the cheap energy led to many new manufacturing plants. Also, abundance of gas meant cheap feedstock for chemical industries in addition to cheap energy. Investors from China, Germany and Taiwan, amongst others, have invested in petrochemicals, fertilizers and plastic manufacturing plants in the US. Yerrgin says that by 2019, unconventional energy was supporting 2.4 Million jobs. Did the benefit in trade and manufacturing come at environmental costs? The Shale Revolution has had both positive and negative impacts.

NG fired power plants have led to a decrease in share of coal fired power plants both directly and indirectly. This has reduced pollution as NG burns much cleaner than coal. These changes were also responsible for the reduction of the US’s CarbonDioxide emission. They are now down to 1990 levels. However, fracking can pollute groundwater and also cause Earthquakes. I must note here that Yergin believes that the chances of groundwater pollution from fracking are low because fracking happens at altitudes much lower than groundwater aquifers and that technological advancements have reduced the probability of Earthquakes.

Energy is tightly intertwined with global politics. Many major conflicts in the world are about energy. The shale revolution changed the US’s strategic position. The US became self-sufficient in energy. It is now one of the two powerful countries that are almost self-sufficient in food and energy. This is important as in any crisis, food and fuel are the two most important and urgent things needed by a society. Self sufficiency in food and energy is sure to have an impact on US’s thinking. The US may still intervene in world conflicts to maintain its dominance and to help its allies, but its motivation for such interventions has reduced.

Shale revolution reduced US’s imports, allowed it to phase out coal and has significantly reduced the country’s dependence on the rest of the world. It is truly one of the significant events of the twenty-first century.

If you wish to stay in touch with my writing, follow me on medium and get your stories delivered to your Inbox.

You can follow AskHow India (@AskHowIndia) or me (@YogeshUpadh) on twitter or on LinkedIn

Telegram channel: t.me/YogeshUpadhyaya

Author –

Yogesh Upadhyaya

(Yogesh Upadhyaya is one of the founders of AskHow India. Blogs are personal views.)

0

How did China become a manufacturing superpower?featured

July 31, 2023

Snehal (name changed) was setting up a fine dining restaurant in South Mumbai. When I met him a few years ago, Shehal had just returned from a trip to China. He had gone there to buy furniture and fittings for his restaurant. He described his experience of walking through a humongous mall, accompanied by a salesperson and a ‘tiny little Chinese girl’ with a notepad. Every time he liked something, the girl would write it in her pad. The furniture was delivered to him in Mumbai and paid for in Indian Rupees. According to Snehal, a lot of what he bought was just not available in India. What was available in India was much cheaper in China. And finally, the whole experience of buying was hassle free: something he did not think could have happened here. This is just one of the countless stories I have heard or read about manufacturing in China. Goods are cheaper there, there is more variety, the quality is good and the overall experience is excellent. Ignore the current troubles that China is facing, China is a manufacturing superpower. It is the manufacturing superpower. How did China do it? In this post, I make a few observations without pretending to have anywhere near the complete answers. But first, let us take a quick look at why manufacturing is important.

Image generated on MidJourney by Anurag

The economic historian Joe Studwell has argued that early in the development cycle of a society, the best way to increase productivity is by manufacturing. This is because the majority of the population is unskilled, and machines used in manufacturing increases its productivity most easily. All countries that have made a breakthrough into the high income bracket in the last century — Japan, Taiwan and South Korea — started with manufacturing. This allowed large proportions of their population to be productive and earn relatively high wages. There are a few people who believe that India can bypass manufacturing by focusing on high value services such as Information Technology. I would like to remind them that IT in India employs a very small percentage of the population. Not very surprising when you realize that only 1 in 4 youth in India enrolls in college!

China — like its successful neighbors — focused on manufacturing and has flourished.

China’s amazing manufacturing story

In his book, India’s China Challenge, Ananth Krishnan describes the Yiwu market in Zhejiang. The market stretches over 5.5 million square meters or 750 football fields. From Tanjore style paintings of baby Krishna, to ‘authentic’ Rajasthani jewelry to ‘authentic’ Kanchipuram sarees the market has everything. According to Krishnan, 4,00,000 Indian businessmen visited the market every year. Imagine being so good at manufacturing that you make traditional goods of other countries!

China doesn’t just manufacture trinkets. It is very good in many complex industries as well. In his book, China’s Economy, Arthur Kroeber has a list,

‘China has moved from being a producer of low-end textiles and cheap consumer goods in the 1980s to a country with successful and large-scale automotive, shipbuilding, machinery, electronics, chemicals, and precision instruments industries.’

Also,

‘Chinese firms are important producers of ships, high-speed trains, mining and construction machinery, and power generation equipment, including nuclear reactors.

One of the challenges of writing this essay is that the word manufacturing covers a wide variety of activities. From making cheap plastic spoons that would sell for a few Paise to making the latest computer chips that can be made only in machines that cost more than USD 150 Million! China is present in nearly every niche (though not in high end computer chips) and when you add it all, China’s output is impressive.

Take a look at this chart from the World Bank. In comparison with China’s meteoric rise, the outputs of India and Germany look nearly flat. In actuality, India quadrupled and Germany doubled their outputs over the period!

https://data.worldbank.org/indicator/NV.IND.MANF.CD?end=2021&locations=CN-DE-IN&name_desc=true&start=2001

In some circles in India, there is an impression that Chinese manufacturing is of low quality. That may have been true a decade ago. When I talked to businessmen who have imported manufactured products from China, they spoke of a different concept of quality. Whereas German manufacturers provided only the highest quality at a high price, Chinese companies can provide products of different quality at different price points. From perhaps a slightly lower than German quality but at much lower price to a lower quality at a very cheap price.

China manufactures more than anyone else in the world. A significant portion of this is high quality. It built almost all this capacity in the last three decades. How did China do it? What challenges did it overcome?

The manufacturing challenge

In his excellent book “How Asia Works”, Joe Studwell argues that economics of development is different from economics of efficiency. A key part of this difference is in manufacturing. A challenge for any country is that in the initial years, manufacturing needs support before it can compete with companies from developed countries. One key reason is that manufacturing can mainly be learnt by doing. Even when entire working plants are transferred, it takes a lot of learning for the new owner and workers to produce goods of the same quality as the original plant. During this period of learning, entrepreneurs need a lot of handholding. This support can be in the form of subsidies, cheap inputs (including funding) and tariff and non-tariff barriers to imports.

However, if this support continues for a long time, there is no incentive for the entrepreneur to improve. After all, if a business is not under any pressure, why would it make its products cheaper or improve their quality? Competition is one inoculation against such complacency. Another is demanding customers. In the initial years such customers would be mainly in the world markets as the domestic customer is not very discerning.

Support your nascent manufacturing industries strongly and then force them to become world class. According to Studwell, this is the model followed by Japan, South Korea and Taiwan and also China.

China overcame the challenge of learning partly by getting the world to teach it.

Learning from the world

China gave extremely generous terms for foreign manufacturers and wooed them aggressively. In its Special Economic Zones (SEZ), China took all kinds of steps to ensure that foreign firms were welcome. Fast clearances? No problem. Infrastructure to facilitate rapid export of output? Check. Cheap credit? Sure. Labor problems? No chance. Governments and party officers would make big promises to potential investors and would nearly always deliver. Kroeber has statistics on the importance of Foreign Direct Investment (FDI) in manufacturing and exports in China.

‘From 1985 to 2005, annual FDI inflows averaged nearly 3 percent of GDP*, a very large number. For South Korea and Taiwan during their comparable high growth eras (the early 1970s to the early 1990s), FDI inflows were only about half percent of GDP. And in Japan from the mid-1950s to the mid-1970s, FDI was basically non-existent, running at less than 0.1 percent of GDP.’

The foreign firms imported a lot of the products manufactured in China. Here is Kroeber again,

‘The exports of Japan, South Korea, and Taiwan were exclusively booked by domestic firms. In China, this has not been true at all; since the early 1990s a third or more of exports were produced by foreign invested firms, and the foreign share peaked at 58% in 2005.’

Also,

‘…over 80 percent of “high-tech” exports from China were produced by foreign firms, and the foreign share is still around two-thirds.’

In addition to generous terms, China did one very important thing. It made manufacturers feel welcome. Potential investors would be wined and dined and wooed. This was in sharp contrast to how manufacturers were being treated in the West. There, they could at best hope for a staid respectability. At worst manufacturers would be thought of as greedy, exploitative folk with no concern for their workers or for the environment. In China they were superstars. No wonder investments rushed in.

China was fortunate with its timing as well as its Geography.

Luck in history and lucky in geography

Let me be clear: it was not all luck, but China did get lucky with its geography and also timing. This is what Arthur Kroeber had to say about China’s lucky circumstances

  • ‘Good neighbors: The successful export-drive development of Taiwan, South Korea, and especially Japan gave Chinese policymakers an easy-to-follow template for industrial development.
  • Hong Kong: When China started its reforms, Hong Kong was already a world-class port and trading hub with a modern legal and financial system. This gave Chinese manufacturers quick access not only to global trade routes but also to much of the “soft” infrastructure needed for a modern economy.
  • Timing: China was fortunate to open up to trade just at the moment when the shipping container, invented in the 1950s, was beginning to make possible the creation of global production chains, spanning multiple countries, because of steep reductions in long -distance shipping.
  • A “killer app”: By the late 1980s, culturally similar Taiwan had established a sophisticated electronics industry, which moved en masse to China in the late 1990s, creating a world-class electronics manufacturing base almost overnight.’

Add to this the fact that the country had a lot of support from the United States. As highlighted by Henry Kissinger’s trip in 1971, the US wanted to bring China into its sphere of influence or at least to be neutral in the cold war. This support to China continued in 90s, 2000s and 2010s. There was a widespread intellectual and political consensus in the US that offshoring manufacturing to China was good for both countries.

The foreign investments kick started manufacturing in China. The foreign buyers also demanded a high quality output. Chinese employees and entrepreneurs learnt from this experience and built local companies. When they started, they got the support. One important way this support was provided was by making sure that their inputs were cheap.

Businesses flourish if inputs are cheap

Perhaps the most crucial way of supporting manufacturing is by ensuring that it gets cheap inputs. These inputs include raw material, energy, land and finance. If a manufacturing company has to pay a high proportion of its sales to commodity sellers and to energy providers, it has less money to reinvest in itself to become bigger and also less money to pay for more skilled employees. In other words, it is important for terms of trade to be favorable for manufacturing companies and not for commodity and energy providers. Similarly, if a business pays a lot for land or pays a high cost of capital, then it has less money to grow.

Favorable terms of trade are much more important for low value added manufacturing. A company that makes high precision engineering products can pay slightly higher for raw material as the raw material cost would be a small percentage of total costs. A garment manufacturer or a leather goods manufacturer, however, would be much more sensitive to raw material costs. Such low margin businesses generally are high employment generators. If the inputs are high costs, higher employment generating businesses suffer more.

China has kept most of its commodity and energy producers in the public sector. What is more, the prices that these businesses can charge have been regulated. This meant that the terms of trade were favorable for manufacturing companies using these commodities. Many authors describe how China has resisted pressure to go to a system of ‘market prices’ for such inputs. Non-price interventions such as restrictions on export of raw material are other measures that supported manufacturing.

The commitment of the Chinese government to low input prices can be seen from the Rio-Tinto incident in 2007 as revealed in the book The Party. When BHP-Bilton, the largest mining company in the world, launched its takeover bid for its Anglo-Australian rival, the Chinese saw it as an unambiguous threat. The international price of iron ore had increased fivefold in the five years to 2008. One of the reasons is of course the demand from China itself but China believed that the supply had been kept low by big suppliers by systematic underinvestment. Chinalco, a state owned diverse mining group, made a bid for Rio-Tinto. The bid did not go through but Mr. Xiao Yaqing, president of Aluminum Corp of China (Chinalco), took credit for derailing the BHP-Bilton’s bid. Mr. Xiao Yaqing later went on to take a central government position and eventually become a minister.

While keeping prices of raw material low, China managed to induce its public sector to continuously increase its production of commodities. The coal production in China is a good example. It has kept up with the demands of its hungry power plants.

https://www.iea.org/countries/china

Note that I am not saying that China’s commodity producers are efficient. They may not be. However, cost efficiency may not be the most important factor in delivering commodities cheaply and reliably to manufacturing companies. For example, in India the coal price at a power station can be 5 x of the pit head price. Coal India Limited (CIL) may be bloated. However, the contribution of CIL to the high price is limited. High taxes and transportation costs are what is responsible for these high prices. Imported coal is also a lot costlier than domestic coal for the same reasons. A well executed policy of keeping raw material cost low is way more important than making sure that the public sector units are as low cost as possible.

Let us next look at how China kept land costs low for its manufacturers.

Land

A big difference between China and the rest of the world is that the laws protecting the property rights of rural Chinese are weak. Local urban governments can take over their land in return for a low compensation. In the past local governments have done precisely that. They have then given manufacturing companies as well as real estate developers cheap land. The local governments have two incentives to do that.

Unlike most other places in the world, local governments in China can retain the profit from buying cheap farm land and then selling it. In fact, this profit from land dealing is a significant part of the revenues of many local governments. For some localities, profit from land sales has been as high as 20% of the total revenue. Secondly, local governments were allowed to keep a portion of taxes collected from businesses in their area. Furthermore, a significant portion of the compensation of the local governments officers could come from this share of taxes.

This structure incentivises local government officers to get cheap land for businesses. In general, it creates incentives for more and more businesses to be created. This structure also has ensured that local governments aggressively solicit businesses and deliver on regulatory clearances very quickly.

In the initial learning phase, one of the most important sources of support for businesses is cheap capital.

Patient and cheap Funding

One of the characteristics of Asian tigers -Japan, South Korea and Taiwan — is financial repression in early years. This is inevitable. When manufacturers are learning and are supported by the financial system in the early years, the returns to the depositors are low. In each of these countries, a generation of population accepted low deposit returns. This was an important contributor to the success of manufacturing companies in these countries. This was true in China too.

In the late twentieth century, the Chinese banking system was fairly immature. In the 1990s, the system was dominated by 4 banks known as the Big Four. When the country went into an investment spree, it was supported by the Big Four. The fast lending led to many bad loans and in 1998, the bad loans in the Big Four had reached a staggering 1/3rd of GDP. Kroeber believes that the bailout of the banks was the reason for low deposit rates for savers. He estimates that in 2004–2013, the average real deposit rate was a negative 0.3 percent! Depositors accepted this rate and manufacturing in the country benefited.

In addition to bank loans, Chinese manufacturers got cheap equity capital too. China has many investment vehicles that own shares in both public and private companies. Significant portion of the funds of these investment vehicles comes from the Central and provincial governments. This capital is usually patient capital with not as much emphasis on returns. Here is Kroeber on more recent such vehicles,

‘Since 2014, central, provincial, and city governments have set up around 2,000 “government guidance funds” to promote high-tech development. …In practice, however, most of these funds seem to be thinly disguised subsidy programs, used to channel money to domestic technology companies, with little or no expectation of a commercial return.’

Production linked incentives is another way of providing cheap capital. My interaction with businesses revealed many instances of the price of finished goods being equal to or lower than the cost of raw materials. When asked how they managed to sell at such low prices, their Chinese counterparts would tell them that it was because of the volume linked incentives they got from the government.

One illustration of the effect of cheap finance is Chinese steel. For many years, China exported steel to India. It imported some iron ore from India and coking coal from Australia. Indian producers could not compete with the Chinese prices. This is when Indian producers used Indian iron ore which they would have got at a cheaper price because they would not need to pay the high transportation cost that the Chinese producers had to pay. The Indian producers were also using Australian coal. Clearly, low cost of capital and other incentives were at least partially responsible

Cheap (and patient) funding not only makes it easy for manufacturing businesses to compete, it also makes it easy for them to become big. In many businesses, big is better.

Quantity is its own quality

In many industries, having a large size is a big advantage. If you are a big company, you can negotiate and get a lower price from your raw material and your equipment suppliers. Your capital expenditure is spread over a much larger output. Your high production levels mean that you can fulfill bigger orders that your smaller competitors cannot. In short, there are benefits to being large. It is easier being large if the cost of finance is lower. The scale of Chinese manufacturing is huge. Kroeber points out,

‘From 2000 to 2014, China’s steel production rose nearly seven fold, from 129 to 823 million tons, by which point China produced about half the world’s steel…(for cement) again China was responsible for about half of world’s output.’

Imagine the advantage Chinese steel producers would have had if they were buying rolling mills! The scale advantage of Chinese manufacturing is not only in large individual factories but also in Infrastructure.

Chinese infrastructure: Best in the world?

Snehal’s Chinese suppliers could deliver furniture to him in Mumbai, because they could rely on all the logistical, payment and other infrastructure that would be involved. Infrastructure is key to success of manufacturing. I will not spend too much time on Chinese infrastructure here as that topic requires an article of its own and my colleague is working on it. Kroeber has a pithy remark that sums up the China infrastructure advantage,

‘…by the early 2000s, China had a unique and probably unbeatable combination of low, developing-country labor costs and good, almost rich-country infrastructure.’

Today, much of China’s infrastructure may be better than many rich countries.

I will point out that good infrastructure can work for manufacturers in ways that may not be obvious. For example, if a province makes dormitories and food and entertainment places for workers, businesses find it easier to get and retain them. The workers may also stay in the factory just a bit longer and may be that much more productive.

There is universal praise for the productivity of Chinese workers. Let us look at that next.

High productivity — structure or culture?

I heard jealousy in the voices of Indian manufacturers, when they talked about productivity of Chinese workers. According to them, one big reason for this productivity is that compensation in many factories is mainly for piece work. That is, the workers get paid on the basis of the number of products they have manufactured. This compensation structure incentivises workers to increase productivity. However, such a structure can also violate the rights of workers if applied unfairly. In such a scenario, it seems that the Chinese workers do not have recourse to remedies such as protective laws and unions as they would have in other countries like India.

In his book, The Party, Richard McGregor pointed out that the All China Federation of Trade Unions is China’s sole legal trade union body. This body is controlled by the Communist Party of China (CPC). Workers did not have the right to form independent unions.

In addition to these structural differences, it seems that factory work is associated with higher status in China than in India. There seems to be a much higher appreciation of workers, especially skilled workers. A senior executive from a Multi National Company described, with admiration, how in their planning meetings, senior skilled workers such as welders would be present. And they would contribute to the discussion especially in their field. This executive felt that China had some of the best welders in the world and the respect they get is a significant contributory factor to the quality of their output and their productivity. People are proud to ‘work with their hands’. Unfortunately, this is not so in many communities across India.

China now has some of the world’s most skilled workers as well as engineers in many industries.

Not automantons but very skilled workers

A lot of manufacturing work requires skill. More obviously, skill and learning are crucial in improving the manufacturing process. If you look for them, you will find many testimonials for the skills of Chinese workers.

In 2017, Tim Cook the CEO of Apple said,

“China has moved into very advanced manufacturing, so you find in China the intersection of craftsman kind of skill, and sophisticated robotics and the computer science world. That intersection, which is very rare to find anywhere, that kind of skill, is very important to our business because of the precision and quality level that we like.”

Further,

“The products we do require really advanced tooling, and the precision that you have to have, the tooling and working with the materials that we do are state of the art. And the tooling skill is very deep here. In the U.S., you could have a meeting of tooling engineers and I’m not sure we could fill the room. In China, you could fill multiple football fields.”

China now also has the best engineers in all kinds of niches and as a person with an engineering degree, I cannot but compare the situation with India. I graduated from IIT Bombay in the early 90s. A few of my batchmates and I met recently. When I looked around at the small group, I realized that except one person, everyone had careers in finance or software. Even the exception was in a commercial function. As someone who has been in both software and finance, I am in no position to criticize individual choices, but there is no doubt that a lack of preference for manufacturing jobs is not limited to blue collar workers. Thirty years ago most of us did not want to work on the shop floor. It was more lucrative and more prestigious to work in an office. Unfortunately, this is still true.

It is relatively easy for governments to support businesses. It is much much tougher to prevent these businesses from becoming inefficient. After all, if support allows me to make profits, why would I strive hard to become better. I don’t have a complete answer to this crucial question but a big part of the answer is competition.

Many industries in China have fierce competition

China has had fierce competition in industry after industry. For example, Kroeber says that there were 120 car companies in China in 2019!

Entry into any industry was easy and hence entrepreneurs had to be fiercely competitive. If a company that was supplying components to a MNC was unable to deliver on quality, there were others who would take their place. This competition was fueled by entrepreneurs as well as by governments. As discussed earlier, provincial and city governments were allowed to keep a portion of tax revenues collected from businesses in their jurisdiction. What is more, a significant portion of compensation of government officials could come from this revenue. The senior party and government officials would be judged by the party on the basis of the manufacturing and tax performances of their provinces / cities. So cities competed with other cities and provinces with other provinces. The interests of entrepreneurs, senior political leaders and government officers were aligned. Everyone wanted entrepreneurs to get into new industries and do their utmost to make their business successful.

At the beginning of the manufacturing boom, most of China was rural. Young men and women from villages across the country traveled long distances to stay near factories so that they could make more money. It helped a lot that factory work, especially in the previous decades, had a lot of dignity.

Extreme government support, aggressive entrepreneurship and a disciplined work culture combined to propel Chinese manufacturing. Was there a downside at all?

Many accelerators but no brakes

This article is not the place for detailed accounting of environmental costs paid by the Chinese. It is certainly not the place to even attempt to figure out if the trade off was worth it. I would only note that, by all accounts, China has paid enormous environmental costs. I would also note that many reports suggest that the country has become much stricter against polluters in recent years.

The other big risk of the Chinese model is that of overinvestment. It was in the interests of entrepreneurs, financers, political leaders and government officers to say yes. So they did. There was nobody to say no. There are multiple reports of overinvestment in real estate. There are also some reports of overinvestment in manufacturing.

As the demand environment for Chinese manufacturing changes in the coming years, we may get some indication of the costs the country would have to pay. The costs would include financial costs including bad bank loans and spoilt government finances. The costs would also include wrenching social costs that come from sudden unemployment. How high would these costs be? It is impossible to say. Hence, it is impossible to say whether the tradeoff the country made to become the manufacturing superpower was worth it.

Over the past years many business leaders have shared very interesting insights. I present one story that illustrates many themes touched upon in this article.

Case study

Pramod (name changed) has run a mid-sized component manufacturing company for decades. In the 2000s, Pramod tackled the sharp increase in demand for his products by importing from China. The prices that he had to pay were always low and his deliveries always reached on time. There were times that the price was near that of Pramod’s raw material for the same component. Pramod believes that incentives from the Chinese government were at least partially responsible as was the fierce competition within China.

Even today, Pramod finds it difficult to compete with the Chinese manufacturers in the Asian markets. In addition to price and quality, the Chinese manufacturers have another advantage. In every market, there are multiple containers going from all parts of China every day. Small Chinese suppliers can promise 1–2 day deliveries even for small orders (less than a container) whereas Pramod may have to wait for 15–20 days because the number of containers going from India to that country may be very low. The advantage of scale can come up in many ways.

One of Pramod’s best selling products requires him to build a hollow 150 mm Brass tube with an inner diameter of 5mm and an outer diameter of 8 mm. For years, he bought 8mm Brass rods and drilled 5 mm holes in them. The holes would need to be drilled from both sides and would need four separate drilling operations (to take out the drilled material). There were additional challenges of making sure that the alignment from both ends was right. A few years ago, Pramod’s Chinese supplier suggested an alternate method which some European manufacturers had perfected. A 25 mm rod of Brass could be heated and then molded into a tube. The Chinese partner designed and manufactured the machinery needed for this process and installed it at Pramod’s India factory. His Indian competitors have not been able to duplicate this process in spite of years of trying. This is one of the reasons why Pramod believes that even in relatively simple manufacturing operations, the skill levels of Chinese are much higher than that in India.

Let me quickly summarize this long article and discuss implications for India.

Summary and implications for India

How did China become a manufacturing superpower?

  1. Any country Starting manufacturing has a challenge. Manufacturing can be learned mainly by doing. In the initial learning phase manufacturing needs a lot of support.
  2. One way China tackled the problem was by making itself a very attractive destination for export oriented factories of MultiNational Companies (MNC). The export share of MNCs is very high even now. Eager Chinese workers and future entrepreneurs learned the basics of how to produce high quality goods.
  3. China was lucky both with its timing of manufacturing push and because its neighbors helped it start up and also provided it with inspiration.
  4. China supported MNC and local manufacturing companies with cheap raw materials and energy. The manufacturers were also supported with cheap land and fast regulatory clearances. Workers were not only available for low wages but also disciplined and eager to learn. There was also a lot of support from cheap and patient capital.
  5. The Chinese infrastructure miracle was another great support for manufacturing.
  6. Such a high level of support can make entrepreneurs complacent. This has not happened in China. One of the big reasons is fierce competition. The decentralized nature of the country’s governance and the entrepreneurial nature of the society means that there were hundreds of companies in many sectors.
  7. This competition, along with eager entrepreneurs and workers has meant that the Chinese output is now very high quality.
  8. A feature of Chinese manufacturing is scale. Partly supported by cheap capital, many Chinese factories are very large and this allows them to produce goods much more efficiently than many of their competitors.
  9. Manufacturing has a much higher status in China than in many other countries, including India. This applies both for blue and white collar workers.
  10. On the back of government support and the efforts of entrepreneurs and workers, China is now a leader in both scale and quality.
  11. There are costs and risks to the way China developed. Environmental degradation is an obvious cost. The other is overinvestment.

The 11 point list is scary. It looks almost undoable in the Indian context. We can think that India does not have a chance to do what China did and not even try. Or, we could look at each of the points above and ask ourselves how India could do the same. For example, China has kept energy prices low. How can India do the same? Manufacturing in China is cool. How can India do that? How can we make patient capital available for manufacturers while ensuring that they don’t become complacent and remain inefficient? All these are complex topics and I hope to write about some of them in the future.

* A lot of the FDI in China may have come from Hong Kong. Also, there are credible claims that significant parts were round tripping — that is Chinese businesses bringing back money disguised as foreign investment. However, even accounting for this, the differences are stark.

A big thanks to all business leaders who have taken so much time andd patiently explained what they do. I am deeply grateful.

I am trying to understand China better and this is my third article on India and China comparisons. I will keep posting what I learn in this list — Viewing China through an Indian lens.

If you wish to stay in touch with my writing, follow me on medium and get your stories delivered to your Inbox.

You can follow AskHow India (@AskHowIndia) or me (@YogeshUpadh) on twitter or on LinkedIn

Telegram channel: t.me/YogeshUpadhyaya

Author –

Yogesh Upadhyaya

(Yogesh Upadhyaya is one of the founders of AskHow India. Blogs are personal views.)

0

Beware of the coming Sh$# stormfeatured

June 11, 2023

If you are an Indian with American friends, a storm is coming your way. The year 2024 will see elections in both countries. This is a one in twenty year phenomenon. The last time it happened, social media did not exist. Now it is a key vehicle of political messaging. Political campaigns in the two countries will ensure that you and your friends are in a foul mood till the day you cast your vote. We saw trailers of this phenomenon in 2018 and 2020.

Image by 0fjd125gk87 from Pixabay

I have a WhatsApp addiction. In 2020, I noticed that by the end of the day, I was in a foul mood. Discussions in three WhatsApp groups were responsible. These groups had a few people living in the US and many of them were very passionate about the elections. Most of them did not wish Mr. Donald Trump to become President again. A few of them, although less vocal, thought that Mr. Trump was not as bad as his opponents said. The two groups believed that the future of the US and the world depended on the elections. I am not saying who was ‘right’ or ‘wrong’ but that all of them were angry and they clashed regularly. Even if I managed to stay out of those discussions, reading the messages would leave me in a foul mood. Lack of willpower meant that on most days, I did not stay out of the discussions. In fact, on many occasions, I initiated it! In 2018, I saw a similar dynamic, except that the fight was about Mr. Modi. And now we have the two elections in the same year.

The dumbest student of persuasion knows that manipulating our emotions is the way to get us to take actions. Also, negative emotions are stronger motivators than positive ones. Political campaigns do their utmost to make us afraid of and disgusted with their opponents. They take away our uncertainty and replace it with toxic but delicious righteous indignation. Nuance becomes fascism, or demonic, or casteism or communalism. They make us believe that the future of our country and the world depends on us ‘doing the right thing.’ They make us hate friends and strangers for ‘not understanding basic truths.’ They start earlier and earlier and their messages are amplified by force multiplying influencers.

Even if you stay away from Twitter, WhatsApp and other addictions, it is likely that you have friends who don’t. In any case, there are newspapers and good old television. The mood of your friends is set to darken in the coming months and hence, so will yours.

I am not immune to this coming persuasion storm. I know that in the coming months I will be angry without knowing why. I will look at your social media posts and I will marvel at your cluelessness and your bias. I will sneer at your posts and feel bad later.

I write this article in the hope that it will inoculate me just a bit.

Thanks to Gaurav for triggering this post

If you wish to stay in touch with my writing, follow me on medium. Click on the envelope icon to get your stories delivered in your Inbox. You can follow AskHow India (@AskHowIndia) or me (@YogeshUpadh) on twitter or on LinkedIn

Telegram Channel : t.me/YogeshUpadhyaya

Author –

Yogesh Upadhyaya

(Yogesh Upadhyaya is one of the founders of AskHow India. Blogs are personal views.)

0

Professional tip — make goodwill depositsfeatured

June 04, 2023

Do you meet senior people in your client team when your project or relationship is going well? You should. This is a good habit like saving regularly.

Let me begin with a dialogue I had with a brilliant colleague a few years ago.

“Try to meet Pramod at least twice a week.” I told Sudarahan (all names changed).

“I will.” He replied.

Sudarshan was going to a client site in Chennai for implementation of our software product. The implementation was complex. I was not worried about Sudarshan’s technical capabilities but, this was one of his first projects as a Project Manager. A lot of work needed to be done by the client and us in coordination and brilliant people can underestimate the difficulties in such situations. Pramod was the client’s Chief Technology Officer (CTO).

I knew that Sudarshan’s yes was not really a yes. So, I persisted.

“In the first few days, when things are going well, ask for 15 minute time slots with Pramod. Even if it is just to tell him what all things have gone well.”

“Yes, I will.” Sudarshan said.

“You will be busy with urgent issues. You would be tired and sleep deprived. Your client contact will ask you why the meetings are necessary. You will have many reasons for not meeting Pramod ‘today’. But force yourself to set up the meetings.”

Sudarshan started laughing. He knew that I had taken away all his excuses before he had thought of them himself. I could do it because I had used all these excuses myself and then had learned the hard way how important it is to make ‘Goodwill Deposits’ with clients.

Image by Nattanan Kanchanaprat from Pixabay

I was a co-founder at a software company. We were lucky to get many projects in our initial years, but there was a challenge in execution. The Project Manager for many of these projects, that is me, was learning on the job. I am an introvert and was a shy person at the time and this complicated things. However, the biggest problem was that I had a flawed mental model of client vendor relationship. I thought that it was an adversarial one. Put all this together and my inclination was to not seek out senior people in client companies. My reasoning was, ‘If everything is going well, why do I need to talk to them?’ Why indeed.

Experience taught me why. First, the client project coordinator, usually a relatively junior person, did not necessarily understand their own organization and requirements completely. Periodic reporting to a senior person would surface their incorrect assumptions. Assumptions that could delay the project significantly. Secondly, if things are delayed from the client side, you could need the senior person to intervene. For example, if the sales team is not testing the software quickly enough, the CTO may need to talk to their boss. Third, senior executives hate surprises even more than they hate problems. They expect problems in complex projects but they do not want to be blindsided by them. These reasons are easily appreciated. There is an additional psychological reason for meeting senior people when things are going well which is not so well known.

If your first interaction with a senior person in a client organization is when things are not going well, he will tend to associate you with incompetence and failure. This association may be unconscious. If blame is flying around, a lot of it will stick to you in his mind. This will reduce your ability to make suggestions to bring the project back on track. If, on the other hand, you had met him regularly when things were going well, it is more likely that he has a better impression of you and is more inclined to work with you. By meeting the senior person regularly, when things were going well, you banked goodwill with them. You can use this goodwill when the project needs it.

There is no reason for a normal client vendor relationship to be adversarial. The interests of both sides are fairly aligned. Goodwill deposits are a great way of reminding both sides of this fact.

The concept of goodwill deposits is useful in any business relationship. If you are a supplier to a client, make it a point to meet them when things are going well. Even if it is to remind them that things are going well. Of course, like anything else, this could be taken to extremes. You could end up wasting the client’s time. However, if you are a shy introvert, like so many of us are at the beginning of our careers, it is likely that you are banking much less goodwill than you should.

Like regular financial savings, goodwill banking requires just a little discipline. We don’t do it because we have more urgent things to do. But, the returns to this discipline are high.

If you wish to stay in touch with my writing, follow me on medium. Click on the envelope icon to get your stories delivered in your Inbox. You can follow AskHow India (@AskHowIndia) or me (@YogeshUpadh) on twitter or on LinkedIn

Author –

Yogesh Upadhyaya

(Yogesh Upadhyaya is one of the founders of AskHow India. Blogs are personal views.)

0

Geography and demography: China through an Indian lensfeatured

January 23, 2023

I got a WhatsApp forward that said that the rail density in India was more than that in China. Now, we all know about China’s world class infrastructure and its astonishing high-speed trains. The WhatsApp forward seemed to contradict my understanding of Chinese infrastructure. The seeming contradiction was resolved only when I remembered the Hu line: a concept that is critical to understanding the demography and geography of China. This post explores these topics. Let us begin some basic facts.

Representational image by Leng Kangrui from Pixabay

We know that China and India are the two most populous countries in the world. At 1.4 billion, the population of each country is more than that of any continent (other than Asia). We also know that China is much bigger than India. At 9.6 million square kilometers, its area is nearly 3 times that of India. The density of population of China is much lower than that of India. However, the average density does not tell the full story and this is where the Hu Line comes in.

What is the Hu line and why is it important? In 1935, a cartographer named Hu Huanyong, drew a line on the map of China. It divides China into two parts with very different population densities. The line stretches from the city of Heihein in the northeast to Tengchong in south, diagonally across the country. The land on the east of Hu line, is flatter and wetter. The west has deserts, mountains and dry plateaus and is very sparsely populated. According to BigThink, this is how the two sides looked in 2015

· West of the line, 6 percent of the population on 57 percent of the territory (average population density: 39.6 inhabitants per square mile (15.3/km2).

· East of the line, 94 percent of the population on 43 percent of the territory (average population density: 815.3 inhabitants per square mile (314.8/km2).

India also has more dense and less dense parts. The Ganga basin states — Uttar Pradesh, Bihar and West Bengal — are densely populated. In 2011, the density in Bihar and West Bengal was more than a 1,000 people per square kilometer and that in UP more than 800 people per square kilometer. In contrast, places such as the desert in Rajasthan, the forests of central India and the Himalayas in North are sparsely populated. However, our population distribution is not as uneven as it is in China. For example, the density of populationin Tamil Nadu and Kerala, far away from Ganga, was 555 and 860 respectively in 2011.

As I have explained in detail, the density of population in any region is function of how much agricultural land is there to support the population and India has the highest amount of arable land in the world. China has less arable land than India and almost all of it is on the East side of Hu Line.

So, what has the Hu line got to do with train density? Most of infrastructure of China is concentrated in the East of the country. The land West of the Hu line is so sparsely populated that it cannot support a dense rail network. For example, there can only be a few trunk lines to and from Tibet. Most of the vast plateau would be connected only by roads and not trains. This is a significant factor in making the overall density of railways in China lower than that in India*.

The difference in variability in density of population is not the only big difference in Chinese and Indian demographics. India’s population is expected to grow till 2065, whereas China’s population actually shrank this year. This change was long coming. The fertility rates (number of children a woman is expected to have) in both countries has been falling for decades. However, the fall in China was dramatic starting around 1970 as this chart from World Bank shows.

China introduced many population control measures in the 1970s. These included raising the age of marriage, encouraging couples to wait longer to have children and to have a longer gap between children. In 1979 the country introduced the draconian one child policy, which was written in the constitution in 1982. Couples were required, by law, to have a maximum one child. The policy was enforced with instruments such as fines and compulsory measures such as Inter Uterine Devices and even sterilization. Over a period of time, exceptions were introduced in the policy. For example, rural couples were allowed to have a second child if their first one was a girl. Ethnic minorities were exempted from these restrictions. Due to these exceptions, the policy was sometimes referred to as 1.5 child policy.

There is a vigorous debate amongst scholars about how much of the reduction in fertility is due to government policies and how much of it would have happened anyway with prosperity and urbanization. There is no doubt however, that the dramatic reduction in fertility has had many consequences.

The fall in fertility in China was preceded by a boom in child birth which itself came after a famine. The famine killed many of the older people and the boom led to many children. This exaggerated the demographic dividend effect. For many decades, the ratio of working age population to the dependent population was very high in China. Economics and development are complex and multifactor, but there is no doubting that this demographic effect was a contributor to China’s prosperity. The converse of the demographic dividend is now happening in China. As Arthur R. Kroeber says in the excellent book ‘China’s Economy’

“In 2020, a bit less than one in five Chinese is over 60; that figure will rise to one in four by 2030, and one in three by 2050. …By 2035, there will be just over three workers per retiree, about the same as Unites States today. And by 2050 there will be only two — about the same figure as present-day Japan. “

The strict implementation of population control measures in the country had many social consequences. Couples were strongly encouraged to choose between Inter Uterine Device for the woman or vasectomy for the man. Population control measures also undoubtedly led to practices like sex selective abortion as there is a cultural preference for the male child. Couples attempting to evade population control measures engaged in all kinds of practices ranging from abandoning girl children to birth tourism. One very curious social consequence was pointed out to me by a friend of mine — There are many people in China who not only not have a sibling but also don’t have first cousins!

In 2013, China announced some relaxations to the One Child policy for urban residents. In 2015, all couples could have two children. The policy was finally ended in 2021 but it is not clear how much the fertility would rise now.

The geography and demographic history of China are very complex. I have condensed it a lot — each sentence can be expanded to multiple novels and doctorate theses. I encourage readers to go to primary sources for more. Demographics of India is also very complex and consequential. I would encourage readers to got to our detailed piece and my blog posts on this topic. What is not in doubt is that it is impossible to even begin to understand the two countries without appreciating the basics of geography and demographics.

*Readers have pointed out that there are other factors that could make the Chinese rail density lower than that of India. For example history (including impact of freight equalisation scheme), use of water ways (Shankar) and higher speed of trains in China (Abhijit). My original text read as if I think that the density of population is the only reason. That is not so and I have edited this post accordingly.

I am trying to understand China better and this is my second article on India and China comparisons. I will keep posting what I learn in this list — Viewing China through an Indian lens.

If you wish to stay in touch with my writing, follow me on medium. Click on the envelope icon to get your stories delivered in your Inbox.

You can follow AskHow India (@AskHowIndia) or me (@YogeshUpadh) on twitter or on LinkedIn

Telegram channel: t.me/YogeshUpadhyaya

Author –

Yogesh Upadhyaya

(Yogesh Upadhyaya is one of the founders of AskHow India. Blogs are personal views.)

0

Inequality: China through an Indian lensfeatured

January 10, 2023

China is the only country that you can compare with India, given the size, complexity and stage of development of the two countries. Over a series of articles, I will compare the two countries on different dimensions. In this piece, I will talk about reasons for inequality arising from urbanization and rapid development [1].

Representational image by Bernd Müller from Pixabay

Both China and India have developed rapidly over the last few decades: The former faster than the latter. As a country develops, some inequality is natural. An undeveloped country is largely rural and agriculture is the main occupation of people. The income from agriculture is generally not very high. Citizens who are lucky enough to get opportunity in either manufacturing or in modern services, typically in urban areas, see their incomes rise much faster. Farmers in both China and India have faced an additional challenge. Both countries place a heavy emphasis on agricultural self sufficiency, especially in grains. This is a sensible policy for the two gigantic countries. If either of the countries falls short of basic food grain production, they would have to depend on imports. The demand from either of these two giants would lead to a spike in world prices. The sensible policy, however, can slow down the growth of agricultural incomes. In China, this policy is implemented as quotas for grain production. A farmer in China is obliged to produce certain amount of grain even if he has other more lucrative options. In India, a combination of export restrictions and Minimum Support Prices (MSP) create hurdles for farmers to shift away from food grain production.

Migration to places with best opportunities for employment can decrease income inequality but citizens in both countries face challenges. The extent of migration from rural areas to urban areas in China has been astonishing. However, this migration has come under restrictive rules. China has a hukou or residence registration system. Under this system, migrants were not allowed to bring their families when they migrated to cities. If and when they were allowed to bring families, migrants could not admit their children to schools or get medical services or buy formal housing. Even the children of migrants faced discrimination. The hukou system has become progressively weaker but can still impose costs on migrants. For example, migrants still face restrictions when going to cities with a population of more than 5 million where they may have the best opportunities. Many people believe that these restrictions are in place because the elite in the larger cities do not wish to see unfettered migration leading to slums such as those in Mumbai and Manila. The net result of all these restrictions is that even today the wages of rural migrants are 60% of urban residents.

Compared to China, India has very little legal restrictions on migration. In practice, however, migrants have found it difficult to get good housing or medical and health facilities for their families. Migrants may also not get the right to other government services such as food grain in ration shops although there are initiatives to fix such problems.

Unfavorable laws and practices in agriculture and migration have worsened inequalities in China. These practices have an echo in India. However, one of the most significant causes of inequality in China — property rights — is unique to that country.

Until 1990s, most urban Chinese lived in apartments assigned to them by their work units. These state units were told to sell the apartments to the tenants. When the buyers sold their apartments after a lock-in period, they got a much higher price. This was a huge transfer of wealth to urban residents. In 2003, when this transfer was completed, it was estimated that the value of wealth transfer was USD 540 billion or 1/3rd of the GDP in that year. Rural Chinese got no such transfer and what is more their property rights are much weaker.

Under Chairman Mao, all farm land was given over to farming collectives. There was no incentive for farmers to invest in the land that they were farming. Unsurprisingly, the food production fell drastically. The farms were first decollectivized in 1979–83. Farmers got the right to farm a specified plot for 1–3 year. In mid 1980s this was extended to 15 years and in 1993 the term was increased to 30 years. However, a Chinese farmer does not have the right to sell or mortgage his farm. It gets worse. City governments can take over farm land at deeply discounted prices and then sell them to urban property developers at a much higher price. This is a significant source of income for the local governments. The World Bank estimated that in 1990–2010, that city governments took over land and compensated farmers at around USD 300 Billion less than the market value.

In India too, there are hurdles which make it tough for rural property owners to realize the value of their land when they sell it. For example, conversion of Agricultural land to Non-Agricultural land can get stuck in a bureaucratic maze. Additionally, politically connected individuals can prey on the lack of knowledge of farmers and buy their land and then sell it at a premium. These hurdles, however deplorable, are nothing compared to the lack of legal rights of rural Chinese.

In spite of these challenges, China has urbanized at an astonishing rate. In 1978, only 18% of the country lived in urban areas and this had increased to 60% by 2018. As per the 2011 Census, 31.2 % of India lived in urban areas (although this low urban share may be because of our very strict definitions as I have explained here. Under alternate definitions, more than 50% -even two thirds – of India may be urban).

Due to industrialization and urbanization, incomes in China have shot up. In 1979, the national income per person was just 200 Dollars per year. In 2018 it was around nearly ten thousand dollars (India’s income in 2018 was less than 2000). In 1979, 810 million people lived in ‘extreme poverty’ in China as per the World Bank definition. Today the number is less than 10 million. The life expectancy in that country has increased from under 50 to 75 (India’s life expectancy in 2018 was under 70).* Interestingly, China has not only done better than India in Income and quality of life metrics, but also inequality in that country, as defined by the Gini index, is lower.

What China did very well was to create a demand for workers in the manufacturing sector. This demand more than compensated for the severe structural constraints that I have described. The inequality increased but, in my opinion, it was more than compensated for by increase in incomes and other quality of life indicators for most people. Something for the policy makers in India to think about.

I am trying to understand China better and this is my first article on India and China comparisons. I will keep posting what I learn in this list — Viewing China through an Indian lens.

[1] Information on China is from the excellent book “China’s Economy” by Arthur P. Krober, unless otherwise stated.

*The numbers for China and India are from different sources. Rather than getting hung up on precise numbers, note the scale difference.

If you wish to stay in touch with my writing, follow me on medium. Click on the envelope icon to get your stories delivered in your Inbox.

You can follow AskHow India (@AskHowIndia) or me (@YogeshUpadh) on twitter or on LinkedIn

Thanks to Anurag and Rajnish for pointing out typos.

Author –

Yogesh Upadhyaya

(Yogesh Upadhyaya is one of the founders of AskHow India. Blogs are personal views.)

0

Sorting out India’s coal problemfeatured

November 15, 2022

Authors: Yogesh Upadhyaya and Manish Agarwal

The one who sorts out India’s coal problems would deserve Bharat Ratna. Yes, we think that the country should confer the highest civilian honor for tackling this challenge! Coal is that important.

Image by Анатолий Стафичук from Pixabay

What do we mean by ‘sorting out’ the country’s coal problems? We mean answering the following questions and implementing solutions for them

  • In spite of having one of the highest reserves of coal in the world, why do we import so much?
  • How can we eliminate these imports, thereby improving the reliability of our energy supplies?
  • How can we best mitigate the pollution impact of coal mining, transport and usage?
  • How should coal be priced so that consumers get a cheap and reliable source of energy while producers have an incentive to produce more?

This khichdi of challenges cuts across governments, technologies and public and private sector. The consequences of not getting this right are enormous. We hope to describe all of it in this article.

This is a very long piece. If you are short of time, you could read our core arguments and skip to the last section.

Our core arguments

  1. Coal is crucial for India’s development. At minimum we can agree that if India is burning coal, it should not be imported coal. Add to this the fact that India is yet to build its factories and cities. Hence, it will add a lot of power generation capacity in the near future. A significant part of this capacity would need to be coal based. If things do not go according to plan, and things often don’t go according to plan, coal capacity addition may be even more than projected.
  2. The Indian coal sector suffers from three problems. Mines do not produce enough. Our logistics are in a mess. Coal mining, transport and usage is very polluting. All three problems share a characteristic: there is no single solution. We liken them to three Ravanas. The three multi-headed demons cannot be killed by one arrow each.
  3. Indian coal is pricier than it could be. Underlying the problem of high price and low reliability of supply is the fact that coal mining and transport are natural monopolies. Miners — whether in the public or private sector — will take advantage of this fact. Governments have a monopoly on regulation and taxation and are big abusers of this monopoly. They impose such high taxes and duties that more money from coal flows to them than to the miners.
  4. Coal is implicated in Climate Change. Coal fired plants emit more carbon than any other electricity source. The focus on Climate Change has stigmatized coal. This stigma has consequences ranging from lack of courage in the media, to lack of funding for important projects. We believe that not are we not accepting reality but also missing opportunities that could improve economics as well as the environment.

We begin with why we are even talking about coal. Is it not the fuel of the past? Haven’t green technologies removed the need for coal? Isn’t coal dead?

The short answer is “No.”

Reports of coal’s demise are greatly exaggerated

India is importing coal to meet growing demand

Coal based thermal plants generated approximately 70% percent of utility electricity in India in 2020–21. Additionally, coal is used in production of cement and steel. These are crucial ingredients in India’s building its infrastructure and providing its citizens with affordable housing. India imports a lot of this coal. This is in spite of having nearly five hundred years of reserves at the current level of production.

In 2020–21, India imported 215 Million Tonnes of coal worth Rs. 1,16,024 Crores. Domestic dispatch of coal in the same year was 691 Million Tonnes. In terms of weight, imported coal was 24% of total. As a comparison, China imported 232 Million Tonnes of coal. However, it produced 3902 MT of coal. So it imported only 6% of its requirements by weight. Note that the 24% figure underestimates imports as the calorific value of imported coal is generally higher than that of domestic coal. That is, each tonne of imported coal has a higher energy content than each tonne of domestic coal.

We would all agree that if the country is using coal, it should be domestic coal. We should not be paying foreign companies, workers and governments money that could have been paid to their Indian counterparts.

With renewables coming in, wouldn’t this coal usage stop soon? Nope. India’s use of coal will increase in the coming decades.

Continuing growth in imports over next twenty years is not desirable

The International Energy Agency (IEA) has made energy projections for India. IEA says that India would need to add a power system the size of the European Union, to meet growth in electricity demand. This would be because of increasing urbanization and increased manufacturing. Both are needed to increase employment and to improve the economic situation of the citizens of the country. As IEA says,

“More than that of any other major economy, India’s energy future depends on buildings and factories yet to be built, and vehicles and appliances yet to be bought.”

The IEA projections assume a significant renewable capacity addition also but still say that in 2040, the share of coal in the overall energy mix would be 34% (down from 44% in 2019). We are sure the reader would agree that it makes sense for India to use its own coal rather than import from far flung countries.

There is a third argument. What if the IEA projections are too optimistic about renewables?

Energy security requires India to be prepared for the scenario in which Variable Renewable Energy integration remains expensive

Variable Renewable Energy sources — solar and wind power plants — have a huge flaw. They generate electricity only when the sun is shining and the wind is blowing. Not when electricity is needed. The modern world requires on demand electricity. Storing electricity and using it later is costly. Modern world requires cheap and reliable electricity. VRE is not reliable and when stored, is not cheap.

Now, efforts are on to reduce the cost of storage of electricity. But no one can say for sure if these efforts would succeed at the scale needed for India. IEA assumes storage will become affordable by 2030; CEA’s coal capacity addition calculations assume halving of battery costs. (We would be doing a deep dive into renewables and storage soon). In addition to the cost of storage, uncertainties are introduced in any energy projections for India because of factors such as

  • The level of manufacturing in the country could increase more than projected. That would be a good thing because it will generate employment. However, it will also increase the demand for electricity.
  • Urbanization in 2040 could be much more than projected. Again a good thing from many points of view, but again something that would lead to a higher than projected demand.
  • Increased use of electricity in transport (Electric cars, buses and scooters) could increase the demand more than currently projected.
  • The high level of VRE in the grid could increase costs leading to a backlash.

Given these complexities, we should keep Yogi Bera’s admonishment in mind

Indeed, it is tough to make predictions. What is not as tough is to see the cost to a society when predictions about something as critical as energy fail. The Russia Ukraine war has taken the energy prices up and economies across the world are struggling. The industrial powerhouse Germany may need to close many of its factories. The United Kingdom may spend huge amounts of money to subsidize its citizen’s electricity and energy bills. In our neighborhood, Sri Lanka and Pakistan are struggling to provide energy to their citizens. The lessons of the last few months are clear: Energy independence is crucial.

Unlike the United States, India does not have large reserves of Natural Gas. For India to be even at least a little independent, it would need to rely on coal and nuclear power. Our record of putting up nuclear power plants suggests that coal will be the main plank of energy independence.

To summarize, India imports a lot of coal currently and everyone would agree that it makes sense for the country to use domestic coal instead. Even in a future where renewables are successfully and cheaply integrated in the India grid, we will see an increased need for coal. It makes sense for India not to import this coal. Finally, predictions have a way of going wrong and being wrong about energy can be catastrophic. Coal provides the only insurance for India against such a catastrophe.

If we have convinced you even a little bit about the importance of coal for India, we are sure you must be asking yourself why is our coal policy such a mess? Let us answer that question.

Our coal sector is not healthy because of rent seeking monopolies

With approximately one fifth of the consumption of China, we import nearly as much as them. Coal consumers pay more than double of what they could be paying. The mining, transport and use of coal is more polluting than it should be. The primary reason is that coal mining and transport is a natural monopoly. Players in this supply chain — government and private -display rent seeking behavior. Why do such monopolies form?

The energy density of coal is much lower than the other prominent fossil fuel — petroleum. That is, coal has much less useful energy per kilogram than Petroleum. This means that the fuel cannot be transported economically for long distances because the cost of transport becomes a very large portion of the end price for the user. Once a coal using plant is put up, there may be very few mines it can take coal from. The mine owner thus has natural monopoly power on users around it, at least to the extent of cost of transport from an alternate mine. For example, take a power plant that was set up near a coal mine. If the coal mine increases its prices, the power plant cannot do much. The cost of transporting coal from an alternate supplier could be prohibitive. The challenge in India is made tougher as Indian coal has a very high ash content and hence low Calorific Value (useful heat per kg of coal).

Even the coal transporter can have a natural monopoly. The cost of transporting coal by rail or by shipping is much lower than transportation by road. If a railway company has put up infrastructure for transport of coal, it is difficult for road transport to compete with it. The rail company can now increase its tariff significantly as long as it keeps it below what it would cost to transport by road.

Finally, the natural monopoly power can be exploited by the government too. Just as a miner or a transporter can increase its prices, a government can increase the duties and taxes it charges on coal use.

The monopoly powers of miners, transporters and the government do not just reflect in prices. They affect the reliability of supply too. A miner who has a natural monopoly may refuse to enter into contracts that have meaningful penalties for not delivering on promises of quality and quantity. A transporter may do the same. A government may get more interested in its own revenues than it is in low prices and reliable supply. Unfortunately, all of this has happened in India.

Performance of public sector miners

Coal production in India has increased significantly over the last few decades. As Coal India Limited (CIL) likes to remind us, it increased its production from 79 tonnes at nationalization to 622 Tonnes in 2021–22. A near 8 fold increase.

Impressive as this achievement is, as late as last year, power plants were urged by the government to use at least some imported coal. This was because CIL was unable to meet the demand. This inability of CIL is reflected in the contracts it signs with power producers. There is hardly any penalty if it does not deliver the promised quantities. There are regular disputes about the quality that it delivers. Consumers of coal suffer when CIL does not deliver as promised. Power, steel and cement are capital intensive industries. Their profitability suffers every time their capacity utilization falls because of lack of coal. Investors — both debt and equity — do not want to invest in projects that do not have assured supplies of coal.

CIL (and SCCL, the other public sector coal miner) have not been able to fulfill the country’s energy needs. They are not the only ones to blame. Logistics has played a significant part too.

Coal logistics

The landed cost of domestic coal at Mettur Thermal Power plant in Tamil Nadu is Rs. 5,457.58 / MT. The notified price at the ECL mine where the coal comes from is Rs. 955 / MT. The costs associated with logistics are nearly Rs. 3,500 / Tonne! Logistics costs comprise approximately two thirds of the landed cost of coal! This data is from the draft Logistics Coal Policy submitted by SBI Capital / Primus and tells us how important logistics is in using coal.

India’s coal reserves are concentrated in Jharkhand, Chhattisgarh, Odisha and Madhya Pradesh. These are not the most industrially developed states. So, a significant part of the coal mined in these states is transported long distances as these maps (from SBI Capital / Primus) show.

SBI / Primus report has the following table as an estimate of the relative transportation cost of different modes.

Railways charge a tariff lower than the cost of transport by road. Yet, their coal transport tariff is higher than the average for all other commodities. It seems that they are able to use their monopoly power to get a significant surplus from coal transportation. That is not all. In spite of this high tariff charged, railways are tardy in putting up infrastructure between mines and users. Railways also routinely blame shortage of rakes for not transporting adequate quantities to users. This is when it has been transporting the quantity for decades and has good information on how the demand is likely to change year on year. This inefficiency of railways is reflected in road transport commanding a 51% share!

One reason for dominance of road transport is that the initial capital cost of constructing roads is the least. Additionally, roads can be made in all kinds of terrain and you can get away with minimum maintenance. In contrast, constructing railway and waterway infrastructure requires a lot of investment. However, there is no doubt that the monopoly transporter, railways, has not done a great job.

If transport of coal is so costly, wouldn’t it have made sense to set up power plants close to the mines? We increasingly do that but did not do it in the past.

Paying for historical decisions

it makes sense to generate electricity and transport it instead of transporting coal and generating electricity in far away places. And yet, we have done a lot of latter in the past. Distant Punjab has thermal power plants. Like in the example of the Mettur power plant given above, we can be sure that the cost of transport is much more than the notified price and taxes put together! There are many such examples. So why did states build power plants so far away from mines?

This was done in the name of ‘energy security’. Punjab decision makers could trust a power plant to reliably supply power to their citizens only if it was completely within their control. There is some validity to this argument. States have been known to overdraw from central power plants and given the nature of electricity, it is difficult to technically stop a geographically intermediate state, say Uttar Pradesh, to take away electricity generated in Bihar and meant for Punjab. Additionally, India did not have adequate transmission infrastructure to transport electricity from the East, where the coal is found, to the rest of the country. In reality, not only is the electricity generated in far away power plants more expensive, but also it can be much less reliable. This is because transporting coal over rail or road is much more prone to interruptions than transporting electricity over wires.

‘Energy security’ was not the only reason for taking such uneconomical decisions. All of us understand the incentives for a state government to build and operate a power plant within its own borders rather than buying electricity, even if the purchased electricity is much cheaper.

Not only does the country suffer from power plants that are far away from mines, but also it suffers from inefficient linkages. Most of the existing mines are linked to users. These linkages developed over a long time. Hence, there are many instances where mines are transporting coal to far off users when both the users and mines have closer options. Rationalization of linkages would mean lower cost for both sets of users. One challenge in such rationalization is that the quality of coal should be similar.

There is no one solution to the above challenges. For example, new rail lines and conveyor belts need to be built. Wagons procured. Infrastructure needed for sea routes built. Linkages rationalized. A regulator to be put in place for railway tariffs. Indeed, the Ravana of mining has another many headed brother — the Ravana of logistics..

We have seen how the natural monopolies in mining and transport have contributed to the ill health of the coal sector. There is another natural monopolist that has done as badly. Governments. Let us look at that next.

Rent seeking by governments

As we saw earlier, the landed cost of coal at a plant in Tamil Nadu was nearly Five and a half thousand /MT. The notified price at the mine was less than a Thousand and the logistics costs were Three and Half Thousand. Where did the remaining more than One Thousand / Tonne go? It went to the State and Central government as taxes and cesses! Governments in India are addicted to the revenue.

In 2020–21, Coal India Limited contributed nearly 42,000 Crores by way of duties, Royalty, GST and other taxes and levies. These were paid to the central government and to governments of coal producing states. Additionally, the company paid Rs. 5,300 Crores of Income Tax and made dividend payments of Rs. 7,700 Crores. Note that the price of coal is fixed by the government at a high level so that Coal India Limited is in a financial position to pay the Income Tax and the Dividend. As the private sector production ramps up, the royalty and other payments from those to governments will increase sharply. As we have argued, this is a serious Real Ease of Doing Business issue. Incidentally, the high level of taxation acts as a Carbon Tax on coal even though it is not called that.

The governments use their monopoly power to extract surplus from the coal industry. Do they provide services in return? No. Clearances needed take a lot of time.

Regulatory suffocation and center state relationship

Coal exploration and production rights are given by the central government. State governments issue the mining licenses. Both state and central governments are involved in many other aspects of coal mining. For example, the central government controls the dominant player — Coal India limited. The prices notified by CIL and its subsidiaries limit what other players can charge. This is because CIL mines are everywhere and even with its poor service, these mines can provide some competition. The environmental clearance is from the center but the state pollution control board monitors the day to day performance. The dominant user of coal for electricity generation — National Thermal Power Corporation (NTPC) is a central Public Sector Unit (PSU). The state government is of course intimately involved with the working of a coal mine. For example, land acquisition and rehabilitation would be implemented by the state government. The day to day monitoring of compliance with both coal production and transport would be done by state government agencies. This is just a brief description of the spaghetti of regulatory challenges that a coal miner has to overcome.

There have been improvements in the transparency and speed of clearances but much more can be done. Governments have a monopoly on regulation and they charge a huge premium for providing this service. One place where governments have been especially bad is in environmental regulation. We will cover it slightly later in this piece.

The reader must have realized that there is no single reason for the Indian coal sector not meeting demand. Hence, there is no single solution. As Ravana could not be killed by a single arrow, the problems of coal mining also need multiple solutions. Could privatization of coal mining have alleviated some of the problems discussed? Let us look at that next.

Why privatization hasn’t helped much. Yet.

Could the inefficiency of coal miners have been reduced if they had some competition from private sector players? We believe the answer is a qualified yes. Private sector can improve efficiencies if the policy is good. Unfortunately, it is not so easy to come up with good policies for natural monopolies. To understand the challenges in policy making, let us look at the history.

The government of India allocated more than 200 coal blocks to the private sector and public sector non coal producing companies between 1993 and 2010. The Supreme Court of India, canceled most of these allocations in 2014. This cancellation of allocation led to an interruption of coal production from non-public sector coal companies. This not only led to reduction in mining of coal overall, but also removed the pressure that CIL might have faced from the competition.

At the heart of the problem was methodology of allocation. The allocation to private companies was done by a screening committee. The SC determined that there was no transparent and objective criterion for this allocation. Any company, getting the right to mine and use coal would get a huge advantage in its business. For example, if a cement company gets the right to mine coal from a good block, its profits would increase. In other words, the cement company would enjoy the benefit of the mine being a natural monopoly. Why should any private company get to make extraordinary profits? Also, the extraordinary profits would lead to corruption and favoritism in granting of the mining rights.

A policy of auction on upfront lump sum has the opposite effect. Such an auction may allow the government to escape the charge of favoritism, but it would increase the costs of the bidder. Higher costs would mean higher prices. That is not in the interest of the wider society. Remember, low price is a goal of energy policy.

The current privatization policy allocates mines to the bidder that promises to give the governments the highest share of revenue. This approach clearly prioritizes revenue for the Govt over minimizing cost of coal for users. The private operator is anyway interested in as high prices as possible. The only, and imperfect, check on prices would be the notified price from PSU miners. It is an imperfect check because though mines can dictate prices, the notified prices of CIL mines act as a cap, depending on their distance from the consumer. The notified prices for CIL have not changed significantly in the last four years. Who knows what will happen in the future? A cash strapped central government could significantly increase the notified price of PSUs and they would be cheered by the equity holders of these companies. The private miners would also benefit from an increase in PSU prices. Given the large sums involved, the private miners would also have a lot of influence on governments. Keeping a check on rise in prices is perhaps the most important part of ‘sorting out coal’.

The cost paid per tonne of coal is not the only cost paid by the society. There is also an environmental cost. Let us look at that next.

Coal and environment

There is no doubt about the negative impact of coal on the environment. This impact happens in mining, transportation and in end use. Additionally, burning of coal also leads to release of Carbon DiOxide: a gas implicated in Climate Change. Let us look at each of these briefly and discuss what India could do.

Coal mining and transportation

Most of the mines in India are open cast mines. One big challenge in open cast mining is the removal and dumping of the overburden (OB) layer. Additionally, a lot of dust is released in the air severely impacting the air quality. The OB removed as well as coal can runoff into water sources and pollute it. If the mining is carried out below the water table, underground stores of water may get severely polluted. The drilling and blasting of OB can be very noisy. Coal mines in forest areas can devastate wildlife habitat. The list of harms to the environment from coal mining is long. What needs to be done to minimize this harm is an equally long list. Pollution mitigation measures include

  • the use of dust suppressing fluids and equipment
  • systematic dumping of OB
  • wildlife protection measures and
  • many other things.

A lot of coal dust is released when coal is transported and when it is loaded and unloaded. The problem of release of dust is especially high when coal is being transported by road. In addition to the coal dust escaping from trucks, there is the problem of trucks churning up the dust on roads. The problem becomes worse when the roads are not well maintained. In fact, the roads can break many times because the trucks are being loaded beyond their capacity.

Mitigation of this pollution requires many measures. The best one is not to use roads at all and use conveyor belts and / or railways instead. If roads have to be used, then they should be well constructed and well maintained. Additionally, norms such as covering the trucks with tarpaulin should be strictly enforced. We understand that most measures for reducing pollution in mining and transport are not very expensive. It is not about money but about governments implementing the law honestly and competently.

Coal use in power

Coal based power plants are polluting. Especially the older ones. India has periodically attempted to reduce emissions from existing plants. For example, in 2015, the Central Electricity Authority (CEA) identified upgrades in existing power plants to considerably reduce their pollution levels. One of the primary recommendations was to install Flue Gas Desulphurisation (FGD). When coal is burnt, Sulfur DiOxide is produced. This gas is a harmful pollutant by itself and is also a significant contributor to Particulate Matter 2.5 (PM) levels. PM2.5 are very fine particles in the atmosphere that are particularly harmful for human beings and many many Indian cities have a very high level of PM 2.5 pollution.

Unfortunately, the deadlines imposed by CEA and monitored by the Supreme Court have come and gone a few times. There are many reasons for this. Many plants are state owned and know that cash strapped state distribution companies will not increase their tariff. Other plant owners are also not sure if they will get increases in tariff for investing in pollution control equipment. There are technical and practical challenges to retrofitting new pollution control equipment to old plants. It is also not clear how effective some of this pollution control equipment would be. A 2021 review report of the Ministry of Environment Forest and Climate Change noted that “470 running units of 180 GW capacity have to implement the FGD system in one go”, which is unrealistic. The MoEF&CC review report recommended pushing the deadline to 2035, and setting up of a multi-department committee to evaluate these challenges, including the impact on electricity prices.

“Sorting out coal” would mean making sure that the pollution from coal mining, transport and use reduces significantly. As in mining and logistics, many different measures need to be taken. Discussing all of them is beyond the scope of this article. We must mention here again that many of the measures are not necessarily very expensive. Especially when compared to the revenues earned by miners, transporters, users and governments from coal. Reducing coal pollution is not all about money but about increasing capabilities.

Air pollution is not the only concern from the use of coal. The release of Carbon DiOxide from burning coal is also a challenge. Let us look at that next.

Carbon release and coal

Burning of fossil fuels releases Carbon DiOxide (CO2) in the atmosphere. Increased concentration of CO2 in the atmosphere is expected to lead to climate change. There is an international campaign to decrease use of fossil fuels, especially coal. The situation India finds itself in is unique. The following facts make its situation very different from United States and Europe

  • Europe and the United States have mature economies. Their energy consumption is not likely to increase very quickly unlike India.
  • Unlike the United States and Europe, India does not have access to affordable Natural Gas. It has no other option but to rely on coal. Also, while CO2 released per unit of electricity generated is less for Natural Gas turbines, it is by no means zero.
  • In the IEA projections, even with the increased coal use,India’s per capita CO2 emissions remain well below the global average.
  • It must be remembered that climate change is impacted by the stock of CO2 in the atmosphere and not annual emissions. If we attribute the increase in the cumulative emissions of CO2 in the atmosphere to different countries, India comes way down the list. This is even when we include CO2 emissions from land use change and not just from burning of fossil fuels.
  • India is a large country with a large population. Its total CO2 emissions will be higher than say that of New Zealand or Canada because of its sheer size. This is even at extremely low levels of per capita emissions. Thus, the best comparisons are of cumulative emissions per capita and when that is done we find India is nowhere in the top emitter list.
  • In discussions on per capita emissions, we notice a subtext which implies that India is ‘overpopulated’ and hence needs to somehow consume less energy compared to other nations. If you have such opinions, we strongly urge you to read this piece to get exposed to an alternate point of view.
  • Reliable and cheap energy is the foundation of the modern world. Criticality of a reliable source of energy was recently underscored when Germany decided to restart 27 coal based power plants as the reliability of supply of Natural Gas from Russia decreased.

Given the stage of development of India and the criticality of reliable and affordable energy, use of coal in India is set to increase. The world would do well to recognise this reality and help India mitigate the climate impact. This mitigation could be in the form of subsidies for technologies that burn coal more cleanly, for more efficient transport and for deployment of carbon capture technologies. One of the reasons that all this does not happen is the stigma around coal.

Investor behavior — stigma

When was the last time you saw news on coal mining on the first page? News about a new mine commissioned? Or a coal mine to power plant linkage rationalized leading to lower transportation costs and lower carbon released? Or a more efficient plant being commissioned leading to lower costs, pollution and lower CarbonDiOxide emission? In contrast, the front page of newspapers would have news about solar plants or manufacturing of hydrogen electrolysers often from the same group that has made investments in coal mines and power plants. Unfortunately, it is not just in newspapers.

In our deep dive into this topic, we saw too many analytical pieces on decarbonising energy that totally ignored the fact that the goals of energy policy have to be reliable, cheap and clean (with decarbonisation being a subset). And that there is a tradeoff between the three goals. Ironically, many of these ‘analysts’ on LinkedIn have articles on Work-Life balance but never try to balance decarbonisation with reliability and cheapness. We recommend that readers ignore any analysis that focuses on only one goal. Unfortunately, it is not just analysts that are wearing blinders. Investors are in the same category.

Many investors are shunning the entire coal value chain because it makes them look bad in the ESG mirror. The fact that efficiencies in coal mining, transport and generation lead to a cleaner route to affordable electricity, does not seem to be appreciated.

Sorting out coal would mean creating investor interest in coal. Especially in projects that lead to the win-win-win of cheaper, more reliable and cleaner!

As we have discussed, sorting our coal means doing hundreds of things. From making mine operations more efficient to optimizing logistics to tackling pollution to getting privatization and pricing right. How is India doing on all these fronts?

Is India sorting out coal?

In a recent conference, both the coal minister and the coal secretary mentioned that the Prime Minister of the country considers the import of coal paap (a sin). The government has declared a target of production of 1.5 Billion Tonnes by 2026–27. We believe that this is a significant declaration of intent and we couldn’t agree more with Shri Narendra Modi. But how do we know if this intent is being backed by action on ground?

For sector-outsiders like us, the only way to know if the 100s of actions that need to be taken are indeed being taken is to look at the overall production, dispatch and price figures. As mentioned earlier, till last year, India was asking power plants to import coal and blend it with domestic coal because we could not mine and transport enough.

It seems that in the current year, till August ’22 the production has increased over the last year. The production in this year was 324 tonnes, a 23% growth over last year. Does this show that we are likely to meet our target for 2026–27? How would we know if we are meeting the many challenges in logistics and pollution control? How would we know if we are meeting the challenges of making our coal sector reliable, cheap and clean?

As outsiders to the sector, we can track progress on some of these dimensions.

If we manage to show improvement in all the measures given above, it would be a tremendous achievement. An achievement worthy of the Bharat Ratna.

We owe Pukhraj a huge thank you for helping us understand this complex sector. Errors are all ours.

Thanks to Rajani for proofreading.

This is the second of our deep dives into the complex topic of energy. The first piece, on challenges in creating markets in electricity, can be found here. We will be working on green technologies and storage next.

You can follow AskHow India (@AskHowIndia) or Yogesh Upadhyaya (@YogeshUpadh) on twitter or LinkedIn or on https://t.me/YogeshUpadhyaya

Follow Manish Agarwal (@manishbgagarwal) or find him on LinkedIn

(Blogs are personal views.)

0

Why is it difficult for markets to work in the electricity sector ?featured

September 11, 2022

Authors: Manish Agarwal and Yogesh Upadhyaya

“Market forces will resolve all issues in the electricity sector.” We hear this often. We believe that unless you work through the details, this is a lazily held view. Electricity supply is very different from products like ball bearings or ice cream — where the markets can become competitive much more easily. Electricity has many structural barriers to competition. In this article, we will point out why it is infuriatingly difficult to create a competitive market in electricity. Some of these barriers are specific to India and others are caused by the nature of electricity itself.

A few months ago, Akshay Jaitly and Ajay Shah published a paper, “The lowest hanging fruit on the coconut tree: India’s climate transition through the price system in the power sector.” Unlike many other commentators, the authors have worked hard at building a case for a price driven electricity sector. In the paper, the authors write

“All firms in the electricity sector need to be creatures of the market economy, which constantly reshape technology and business models in response to prices.”

“The problem is at the core: a government-controlled centrally planned system.”

“This involves going with the grain of the price system i.e. stepping away from the command and control system”

Jaitely and Shah have argued that a market based electricity sector combined with a Carbon tax is the best way to decarbonise the Indian electricity sector.

In this article, we will show why it is extremely difficult for firms (and customers) to be creatures of the market economy. We will also show that a lot of problems of the electricity sector are not because it is government controlled, but because elements of the sector are highly prone to becoming a natural monopoly. Even parts that could be set up as a competitive market will be susceptible to market failures, with the risk and impact both being higher than in other sectors. These reasons make it extremely difficult to leave fuel choice and capacity additions to market forces. Privatization can lead to operating efficiency, as experience in India has shown, but even that needs a lot of careful and hard work. Electricity sector is different from ball bearings (their example). Markets can work. But these markets will not work just because the governments ‘leave the sector alone’. On the contrary, they will work only if governments help design these markets carefully and with great humility and monitor them regularly to see if the markets are achieving the desired objective. We should have realistic expectations from what the markets can achieve.

Our core arguments

  1. Reliable and affordable electricity is key to development. Citizens cannot go about their daily lives without transportation, refrigeration and many other products and services which depend significantly on electricity. Modern businesses cannot survive without reliable and affordable electricity. Income levels and quality of life of Indians cannot be improved without reliable and affordable electricity. Hence, decarbonisation of electricity cannot be the only objective of the electricity sector policy. Any sector reform program (including reliance on competition and market forces) has to be tested on its ability to provide cheap and reliable electricity.
  2. Most of the challenges of the electricity sector in India are in distribution. Most distribution companies have high transmission and commercial losses. It is extremely difficult to create competition in distribution. Privatization with enlightened and strong political and bureaucratic support is what has worked.
  3. Market means producers and consumers being free to choose each other. This is difficult to do in the electricity sector because demand and supply is bid for and matched days in advance and this makes it easier to manipulate the market. More importantly, in India cross subsidy makes creation of markets almost impossible. Finally, to create meaningful markets, supply from existing producers would need to be allotted to new players. All these make the electricity markets synthetic and unlike most other markets.
  4. If somehow a market for electricity were to be created, the price signals would have no influence on most electricity suppliers. The dominant coal producer in the country, Coal India Limited (CIL), does not respond to price signals. India has a high share of hydroelectricity and many dams have dual objectives of irrigation and electricity generation with the former taking priority. It is impossible to set up nuclear power generation plants based purely on market signals without any government involvement. Renewable energy has thrived because it was kept outside the power market, and was required to be dispatched whenever available.
  5. Leaving fuel choice and capacity addition to market forces can be disastrous for India. If private investors do not invest in fossil fuels, and electricity storage solutions do not become cost-competitive at large scale, India could fall foul of its objective of reliable and cheap energy. Achieving the objectives of cheap & reliable power and decarbonisation will need a calibrated, dynamic balance; the Government will necessarily need to be actively involved in this.

Our argument in detail

Before we begin, it is important to state what this article is not about. This article is not about maintaining the status quo. This is not an argument for continuing with public sector dominance of the power sector, and the regular bail outs of Distribution Companies (discoms). We very much welcome private sector investment and associated efficiencies; but want to caveat the challenges in harnessing those efficiencies, and point out why “let Govt get out of the way” is neither feasible nor consistent with the energy sector goals of the country.

Both the authors share the frustration of Jaitely and Shah with the electricity sector. One of us (Yogesh), started his career advising the State Electricity Board (SEB) on privatization related issues. He then switched to rating SEBs and other entities in the electricity sector. Five years of this and he was so frustrated with lack of progress in the sector, that he went out and co-founded a software company. The other (Manish) had a similar start but had the gumption to hold out for much longer. He not only advised state entities on privatization of generation but also actively worked in privatizations in Orissa and other discoms. He has advised the Central Electricity Regulatory Commission in its early period, and spent three years in Andhra Pradesh Electricity Regulatory Commission, in designing regulations and supporting tariff making. He has spent a fair part of his career working with policy makers and regulators to enable more private sector investment in the electricity sector.

Both the authors also share the love that Jaitely and Shah have for market based solutions. One of us (Yogesh) ran a Fintech company for ten years and can personally testify to the benefits of unfettered innovation. In his writings, Yogesh has spoken admiringly about Friedrich A. Hayek’s “Use of knowledge in society.”. The other (Manish), in his decades in consulting governments, has many times advocated for and seen the benefit of the energy of the private sector. These benefits are reflected in data. For example, private sector power generation companies set new benchmarks in plant availability (from 68.5% to over 95%), coal consumption efficiency (reducing Heat Rate from over 3000 kcal / kg to below 2000 kcal / kg) and construction time (reduced from 45 months to less than 30 months). Many public sector generation companies now deliver these benchmarks. Subsequently, in implementing the reforms envisaged in Electricity Act 2003, Manish was actively involved in design of power markets, enabling open access, and reducing cross subsidies.

We begin our detailed working with a very basic but often forgotten observation. Decarbonisation cannot be the only aim of an energy or electricity policy for India. Electricity is critical infrastructure and it needs to be reliable and cheap.

Cheap and reliable energy is critical for development

a. India needs affordable energy to increase income levels

Affordable energy is critical for development. History shows that economic growth accompanies periods when energy is available cheaply. As Vacalav Smil points out in his book “How the world really works” while talking about the oil crisis of 70s,

“..and this ended the era of rapid economic expansion that had been energized by cheap oil. From 1950 to 1973 the Western European economic product had nearly tripled and the US GDP had more than doubled in that single generation.”

Cheap energy is crucial for businesses. If energy is expensive, businesses have less money for investing in growth and for paying their employees. Cheaper energy is a key part of Real Ease of Doing Business as we have discussed here. Citizens and the economy are also very sensitive to the price of energy. High energy costs can severely affect households. High energy costs can also wipe out the surpluses of farmers and of businesses. High ball bearing prices do not have anywhere near the same impact.

b. Reliable electricity is critical to modern life

Energy should not only be cheap but also reliable, i.e. available on demand. Modern life is not possible if energy is not available reliably. We would not be able to perform basic functions like cooking at home and commuting to our work place. Logistics chains would not be able to supply all the goods that we consume.

Given the centrality of energy in society and economy, cheapness and reliability should definitely be the goals of the society’s energy policy.

Electricity is the most convenient form of consumable energy. Use of electricity is effortless — you just have to flick a switch. It is clean at the point of use. No fuel needs to be stored. No stoves need to be cleaned periodically. This is why all modern societies have an increasing electrification. Given the criticality of electricity to society, the electricity grid needs to be reliable. Here is Smil again,

“A very high reliability of electricity supply — grid managers talk about the desirability of reaching six nines: with 99.99999 percent reliability there are only 32 seconds of interrupted supply in a year! — is imperative in a society where electricity powers everything from lights (be they in hospitals, along runways, or to indicate emergency escapes) to heart lung machines and myriad industrial processes.”

A tragic and dramatic demonstration of the importance of electricity came about in the last two years when patients across the country died from Covid when power cuts made it impossible for them to get Oxygen. A google search of ‘power cut covid death’ throws up pages and pages of results. India should also be targeting the reliability targeted in western grids.

c. Governments will intervene if the market makes electricity prices go high

If electricity is not cheap and reliable the society suffers. If ice cream or ball bearing supplies are not cheap and reliable, it is a minor inconvenience. In that sense, electricity is similar to any other infrastructure sector like roads, telecom and ports. Like any other infrastructure industry, society should be investing for the demand we would see tomorrow and not today but markets may not always ensure that. This is because, for producers, the benefits of shortages and the costs of over capacity may be symmetrical but for a society the cost of shortages may be much more than the cost of overcapacity. We will look at this issue in detail in our section on markets.

Having looked at the criticality of electricity, let us turn our attention next to distribution. This is the area which is most in need of reform. This is also the area where the power of markets does not work.

Power sector cannot have “all players as creatures of the market”

The electricity sector can be understood as three broad segments. a. The transmission and distribution wires (along with the transformers, capacitors, meters, etc); b. the power plants that generate the electricity that flows over these wires and into our homes, malls, farms and factories and c. customers.

a. Viable discoms are prerequisite to creating a market

The wires business (transmission and distribution) is a natural monopoly. It does not make sense to have multiple grids in a region. For example, anyone setting up a second transmission wire from a distant power plant to the grid would always be outcompeted by the existing player.

A large part of the challenge in the electricity sector — probably the largest — is that the tariff for many categories of customers is lower than the cost of supply. This low tariff is cross subsidized by other categories of customers, typically business customers. The high tariff for businesses incentivises them to steal electricity, often with the help of discom employees. The AT&C losses across the country were 20% and the combined losses of distribution companies was Rs 75,000 crore in 2019–20. Note that most of the power generators make profits but get into financial trouble because the financially strained distribution companies do not pay them on time.

Improving the operations of a distribution company means

  • Accurately measuring the electricity consumption for the customer categories that are subsidized.
  • Raising tariffs for the subsidized customer categories.
  • In case, the state decides to subsidize a certain category of customers, making sure that it pays the subsidy to the distribution company in time and in full.
  • Stopping theft of power.
  • Reducing technical losses.

c. Discom viability depends on regulation, political will, fiscal space, and perhaps privatisation

The first thing to note is that these improvements, if they happen, will not be driven by competition but by the regulator and by the distribution company operator. More importantly, all the above require a tremendous amount of political will. A big risk for any private entity is whether the political will to support such reforms will continue in face of protests, electoral reverses and change in government. Added to the risks is the challenge that the return of the distribution company is capped by regulation. This incentivises private operators to indulge in illegal practices such as gold plating investments (that is inflating the cost of equipment to get a higher return) potentially negating the benefits of increased efficiency.

The empirical evidence for benefits of privatization of distribution is mixed. The privatization of three distribution companies in Delhi can be termed a success. In Delhi, for example, the AT&C losses came down from well over 60% prior to privatization to below 40% by the fifth year and below 20% by the tenth year of privatization. In Orissa, the privatization of distribution had to be reversed. There is evidence to show that a carefully managed privatization of distribution with backing of political will results in better operating efficiency. However, these gains do not come from ‘market forces’ but come from the working together of an enlightened regulator and an efficient operator and government. Success also requires a strong and long term backing of political reforms.

Private operators need a very high level of confidence that when they start detecting and preventing theft of power, the political system will back them up fully, and protect them from local backlash. Achieving this was difficult in Delhi, and more so in Bhivandi (a handloom dominated area outside Mumbai, where Torrent, a private company, has been distributing and supplying electricity for many years). The success in Delhi and Bhivandi have not led to many more States going down this path. The reason, perhaps, is that the benefits do not seem to outweigh the political costs.

If competition is not possible in distribution then what do people mean by market forces in the electricity sector? It is customers and suppliers having a choice to trade with anyone. Let us look at that next.

Electricity markets are synthetic; need careful monitoring

There are two levels at which competition works in the power sector (not mutually exclusive). One is known as Bulk Supply competition, where generators and large purchasers (primarily Discoms), transact in a Power Market. The other is known as Retail Supply competition, where multiple suppliers compete to supply to end consumers, using the wires of the discom.

a. Competition cannot be effective if price regulation prevents cost-reflective tariffs

Let us talk about Retail Supply competition. This is the ideal world that is imagined by those in favor of unleashing market forces. Monopoly distribution companies that are regulated (and contribute a very small proportion of the overall cost); and several suppliers (generators and traders), providing tailored packages to different types of consumers. Customer choice, as in case of telecom and direct-to-home entertainment, is expected to be replicated in the power sector. Setting up customer choice is extraordinarily difficult. Let us discuss some of the difficulties.

The first difficulty is that to set up a working market requires the elimination of cross subsidies. What are cross subsidies? Well, certain consumer classes (typically, industries and commercial offices / malls) are charged a tariff much higher than cost, so that the surplus can be used to keep tariffs below cost for other consumers. In India, industry and commercial businesses pay much higher tariffs than agricultural customers and many households. This is when the cost to supply to industries is a lot less than the cost to supply electricity to farms and to houses. This is because of the long low tension distribution lines needed to supply to farms and houses.

Why does cross subsidy become a hurdle to Retail competition? Clearly every supplier would want to supply to industrial and commercial customers. The supplier left with subsidized customers will have an extremely unviable business. To compensate, the regulator could allow a cross subsidy surcharge to be levied on suppliers who are serving businesses. This, along with other non-tariff measures, make it unattractive for alternate suppliers to compete with the discom. In any case, these charges distort the market and reduce the power of prices.

The Electricity Act (Amendment) Bill has proposed a cross-subsidy fund, as a means to enable retail competition. We have discussed our concerns with the Amendment Bill here . Taking subsidy delivery away from the Discom is a necessary step. Its success will be critically dependent on the fiscal capacity of the State and the detailed design of the cross subsidy fund.

b. State Governments do not have the fiscal space to allow prices to reflect costs

How difficult is it to eliminate Cross Subsidies? It is so difficult that State Governments insisted on the Electricity Act to be amended, so that the provision to eliminate cross subsidies can be deleted. On all India average basis, industrial and commercial consumers pay Rs 7.4 per unit and Rs 8.1 per unit, while domestic and agricultural consumers are charged Rs Rs 4.5 per unit and Rs 0.75 per unit. The difference is wider in several States.

If somehow, a state government was persuaded to eliminate cross subsidy and promise the distribution companies that they would pay them the subsidy from their budget, then we run into a different set of problems. It would be very difficult for any reputable business to trust a government to make these payments in a timely manner.

We earlier mentioned that we like the idea of Direct Benefit Transfers (as Electricity Coupons, if there is concern about the money being used for less productive purposes). We also like the idea of Cross Subsidy removal, because it would make the Indian industry more competitive. But that also means more burden would be on the State Govt to subsidise needy categories (remember, affordable power is necessary for economic growth). Imagine the fiscal cost of removing cross subsidies, where State Govts have extremely limited ability to raise taxes. Imagine the political cost of removing cross subsidies, and making industrial tariffs lower than agricultural and household tariffs because it costs less to supply to industry than to households and agriculture.

c. Consumers cannot respond to price signals if prices are not deregulated

Finally, we note that if customers are subsidized, then those customers would not respond to price signals. A farmer that is getting free power has very little incentive to not waste it by leaving the water-pump on all night, for example. Additionally, the cost of power varies by time of the day and time of the year. For a power market to function, this will need to reflect in consumer end tariffs. Implementing Time of Use tariffs requires advanced meters to be installed at the consumer end. While a program to do so is underway, it will take a long time. Considering the large population of consumers that have not paid flat meter based tariffs, implementing time-of-use based pricing poses a challenge for regulators and discoms.

d. Even in developed countries, power markets have been gamed

If governments were persuaded to remove cross subsidies and provide timely subsidies, we would face another set of difficulties in creating markets in electricity. Electricity markets are synthetic, and prone to gaming; so difficult to set up and regulate. Why is this?

In a grid, the demand and supply has to be exactly matched at every instance. If the demand and supply are not in balance, the grid can collapse and even damage the equipment. In other words, a shortage in one area can lead to widespread non availability of the grid.

This means that the only way to ensure reliability is to have production capacity and affordable storage in excess of peak demand. Again this is not true for other industries. A production shortfall in ball bearings can be easily managed because of inventories that exist through the supply chain.

To ensure grid stability, a System Operator determines when and which suppliers would meet demand. Similar regulatory bodies also create the market for electricity. The System Operator monitors its functioning. This market is created hours and sometimes even days in advance. If a significant supplier fails to meet the demand of a customer, not only is the supplier in breach of contract of the contracted customers, but also the supplier can make the whole grid unstable. This is not the case in any other product or service. This grid manager can be a government body or could be a cooperative but no sizable grid across the world works without such an active hour by hour centralized manager. In this sense, ‘centralized command and control’ is built into the structure of the sector.

This characteristic makes electricity markets very open to manipulation. This is precisely what happened in the California electricity crisis of 2000 and 2001. Electricity prices rose sharply during times of high demand. The situation was manipulated by Enron. Company officials were caught on tape cajoling power plant operators to shut their plants so as to raise the prices even further. Apparently, Enron had many different strategies for price manipulation — with such innovative names as Deathstar, Black Widow, Big Foot, Cong Catcher, Forney’s Perpetual Loop, and Red Congo. Customers had to pay Billions of Dollars in surcharges.

e. Reallocation of contracts, to reduce market dominance, will be complex and long drawn, to avoid charges of favoritism

This is not all. If markets have to be set up for electricity, existing depreciated assets have to be allocated to all suppliers of electricity fairly. If, as an incumbent, I own generation assets that have been paid for, and have contracts with power producers who run depreciated plants, then I would have an advantage over any new comers. These assets have to be distributed over all newcomers for any competition to be meaningful. However, this redistribution would be done in a process designed in the backrooms of government and corporations. Hardly a description of competitive markets.

Overall, given the complexities, making a statement about the efficacy of electricity markets is meaningless unless you have looked at the detailed rules that govern the set up and the running of the markets.

In summary, markets cannot work without removal of cross subsidy and a believable commitment from the state government on payment of subsidy. Also, it is meaningless to speak of the efficacy of these markets unless you look at the detailed setup. If somehow, we are able to set up very good and robust markets, we come to another problem. Most of the cost of supply is in generation and most power generators cannot meaningfully respond to price signals.

Most power producers in India cannot respond to price signals

Most of the generation capacity in the country cannot respond effectively to price signals. Coal fuelled thermal power plants are responsible for approximately three fourths of electricity generated in the country. For the older depreciated plants, fuel costs constitute most of the costs. More than half of these plants get coal from Coal India Limited (CIL). CIL is almost a monopoly and does not respond to price signals. If it did, it would have produced much more coal and not forced users in the country to import more than 200 MT every year.

Other coal plants import coal. Price signals from the electricity market cannot impact the imported coal price too much. Incidentally, creating a competitive market for coal that delivers cheap coal is not a trivial task at all.

India generates a lot of electricity from Hydroelectric power plants. These plants have a dual purpose of serving irrigation needs and generating electricity. In most plants, irrigation takes a higher priority. For example, a hydroelectric power plant cannot save water for summer when the demand is maximum, if its irrigation consumers require the water earlier. Hydroelectric power plants are not free to respond to price signals.

Nuclear power plants are considered by many to be an essential part of the decarbonisation strategy. We will go into the benefits and risks of Nuclear energy in a subsequent piece but we note here that given the dual use nature of nuclear energy and given the high initial capital costs, it is impossible to build nuclear power plants based on market signals and without intimate involvement of the government. Please see box on France and Nuclear energy for more on this issue.

Ironically, the Variable Renewable Energy Sources (Wind and solar) can be integrated in grids only if we ignore price signals. A lot of the Variable Renewable Energy projects were possible only because they were allowed high tariffs. Even today, a VRE project would not be viable without a ‘must run’ status — an obligation of the DISCOM to buy electricity from these plants whenever the sun is shining or the wind is blowing.

Jaitely and Shah have spoken a lot of Carbon Tax being the only policy lever. As an aside, we note that government extraction from taxes, levies and dividends from the fossil fuel sector is already very high. In 20–21, fossil fuels contributed more than a third of the central government revenues (without borrowings). This is a significant Real Ease of Business issue as we have discussed.

We have discussed till now why reliable and cheap electricity should be a policy goal. We then detailed how it is impossible to create a market in distribution — the place where most of the problems of the sector lie. We then discussed challenges of creating markets in electricity supply. And we just said that even if electricity markets were to be created, the price signals from them would not impact most of our domestic suppliers. There is another challenge with fuel choice. Electricity markets are not very good at allocative efficiency.

Markets cannot deliver the balance between energy security and decarbonisation requirements of the country

Energy prices have shot up across Europe and the world since the beginning of the Russia Ukraine war. Energy bills for households have gone up many fold across Europe and businesses are in trouble even in industrial power houses like Germany.

As we discussed in one of the first sections, electricity and energy in general is crucial to economies and disruption in supply or increase in prices can cause severe distress to the society. A cheap source of energy may be fine for many years but if the supply and price is not in your control it is a looming risk, as Germany and Europe have discovered. Markets are incentivised to optimize short term costs and not reduce long term risks. Let us take an example.

In theory, it sounds simple that a Carbon tax tilts the playing field in favor of clean energy, and it is then left to the market (i.e investors) to decide on capacity addition (fuel, location, size). In practise, this can be disastrous for the country, and politicians will not (and should not) permit this. Can coal based capacity addition (the cheapest source of power, and essential for reliability) be left to private investors ?

a. If electricity storage costs do not decrease rapidly, coal plants will be extremely valuable, and, in a competitive market, be able to demand high prices. In practice, investors know that Governments will not permit them to charge high prices (as we have seen with windfall gains tax in Europe and price caps in India, recently).

b. On the other hand, if electricity storage costs do reduce, the private investment in coal plants could become worthless. Thus, with risk of downside, and unlikely upside, private investors will not invest in coal plants in absence of long term assured offtake commitments from discoms

c. The biggest hurdle to private investment in coal is that financial investors are not willing to invest in fossil fuels, following the ESG and net-zero commitment requirements.

What would happen if the market forces do not lead to coal based generation capacity addition, and electricity storage does not become affordable ? The Government cannot afford such a situation to arise, and therefore needs to actively, and dynamically, take decisions to avoid a situation of expensive and/or unreliable power.

Other options for reliable power are hydro and nuclear. The government is the most important decision maker in setting up Hydro and Nuclear power plants, it is clear that markets cannot have any role in deciding the generation mix in the country. This is the decision of the government and is perhaps the most important one that a government can take.

Summary

We have discussed that ‘markets can take care of our problems in the electricity sector’ is a very misleading statement.

  • The objective of reliable and cheap energy should be at the heart of any reform and markets, left to themselves, do not deliver on this objective.
  • The biggest reform is needed in distribution, and competition is not possible there.
  • Making distribution viable would require the political will and fiscal capacity to address subsidies and cross subsidies, and institutional strengthening regulatory authorities and discoms to deliver efficiency improvement. None of these are outcomes of a market; these are prerequisites
  • If these are done, creating a functional electricity market will still be a formidable challenge. It would require allocating existing generation assets (or privatising them), and strong institutional mechanisms to enforce rules and prevent gaming. By nature, electricity markets are ‘constructed markets’. Very different from markets in most other products and services.
  • Even if somehow an electricity market were to be created, most generators would not be able to respond to price signals. Coal supply is a monopoly, hydroelectric plants run according to irrigation needs and not power needs, and renewable energy plants need to be dispatched whenever they are running.
  • Similarly, at the consumer end. If the market leads to shortage and/or price increases, Governments will intervene. The cost of energy shortage to the economy is very high; unlike ball bearings.
  • Finally, capacity addition (in terms of choice of fuel, location, size) cannot be left to market forces. Synthetic markets are not good at delivering reliability, nor in discovering the appropriate cost of reliability. That private investors do not want to invest in fossil fuels (which are the cheapest source of reliable power at present) only compounds this challenge. Considering that the cost of energy shortage is significantly higher than the cost of under-utilisation of assets, Governments will need to remain actively involved in the balance between energy security and decarbonisation.

Twenty years of having a power market have shown that several other steps are needed to reform the electricity sector. These steps are well known. None of them are easy; they require coordination between States and Center, and across departments. But none of them can be wished away by “unleashing market forces”.

We thank Neeraj and Santosh for their inputs

You can follow AskHow India (@AskHowIndia) or Follow Manish Agarwal (@manishbgagarwal) or find him on LinkedIn

Yogesh Upadhyaya can be found on @YogeshUpadh on twitter or LinkedIn or on https://t.me/YogeshUpadhyaya

0

How to have some good political discussionsfeatured

June 13, 2022

Authors: Yogesh Upadhyaya and Anurag Gupta (this post is written in first person but is the product of thinking and discussion of both authors)

When was the last time you were in a good political discussion? A good political discussion, by my definition, is one where the participants learn something new or appreciate a point of view better. Why are political discussions usually bad? It is because our opinions sit on top of a scaffolding of facts and frameworks (mental models of the world) and we have never examined this scaffolding thoroughly. Furthermore, when such opinions are challenged, our feelings get in the way of listening. All this is a recipe for repetitive and cantankerous conversations.

In this post, I will present the 3 Fs of a good discussion — Facts, Frameworks and Feelings. Then, I will suggest a simple technique that will help make at least some of your discussions better. Let us begin by looking at facts.

Image by Gerd Altmann from Pixabay

Facts

It is surprising how little we know about almost anything. Often, our opinions are based on incorrect facts. Let us take some examples. Many of us are frustrated by the quality of government services in India. I come across many people who believe that this is because government employees get a low salary. This is just incorrect. Salaries for government employees are generally much higher than for people employed by the private sector in similar jobs. Or take the fact that only one in four youth in India enrolls in a college. I bet that not many folk reading this piece would be aware of this. Or that on an average a Lok Sabha constituency in India has anywhere between 2.5 to 20 times the voters in other democracies. These facts, if widely known, can totally change a conversation about crucial topics such as employment and democracy in the country.

If a political discussion gets stuck because of a lack of agreement about a fact, then the solution is simple — Google. However, we all know that disagreement on facts is not the main reason for a discussion to get derailed. Many times, we agree on facts but come to opposite conclusions. This is because we have very different mental models, or frameworks, of the way the world works. Let us look at that next.

Frameworks

My father and I used to have many discussions and one recurring topic was foreign investment in India. The country liberalised its industrial and economic policy in the early 90s. My father had a deep distrust of foreign investment. Often he would ask me if I thought that the investors were coming to India for anything other than profit? He thought that it was a clinching argument. His mental model said that if the foreign company made profit it was automatically bad for India. My understanding of the world is different. I think that business is not a zero sum game and a flourishing business can help the society to flourish.

My father and I had very different frameworks for understanding the world. We agreed on a fact — that the motive for a foreign investor to invest in India was profit. But we had very different opinions on the implications of this fact. Why did we have different frameworks? Maybe it was because we grew up in very different times. From all accounts, 50s and 60s were times of shortages and protected businesses. Everyone — from politicians to popular movies — blamed ‘greedy’ businessmen for these shortages. I started my career in the 90s and could see the benefits of competing businesses. It doesn’t even matter why we had different frameworks and it certainly did not matter, whose framework was ‘correct’. The point is that our discussion would get stuck if we didn’t recognise that we had different frameworks.

This difference in frameworks can sometimes be about the objective of the discussion itself. One side could be arguing for what should be and the other side could be pointing out what the reality is. This is the famous normative versus positive point of view. Let us take an example.

India has seen intense conflicts about places of worship. Many Hindus believe that several mosques in the country were built on top of demolished temples. They want to reclaim their heritage, especially in places of special significance. Muslims understandably, do not wish to let go of their place of worship. Additionally, they have the fear that if one mosque is shifted or demolished many more would be too. This is very complex issue and many people try to intellectually side step it by saying, “In modern times, being religious is stupid.” Others may point out that most people in India are deeply religious. It does not matter what you wish the world were, you have to deal with it as it is now.

So, how do we overcome the differences in the way we understand the world? One answer is for everyone involved in a discussion to lay down their understanding of relevant facts and to do their best to state the frameworks that they think they are using. This is hard work. Often, our mental models are invisible to us. It takes a lot of thought to be even aware of a few of them and then a lot more work to articulate them in a way that is understandable to someone else. When I do this thinking in a conversation, my articulation is inevitably weak and self contradictory. I can get into this kind of conversation with very few people: people, who I trust to try to understand what I am trying to say and not judge me.

Laying down the scaffolding of facts and frameworks that supports your opinion is tough even when you take a lot of time. We should know. At AskHow India, we have presented relevant facts and frameworks for many complex issues and it can take us months to nail down what we want to say. The bad news is that even that is not enough in most situations. This is because the biggest barrier to a good discussion is our own feelings. Let us dive into them.

Feelings > (Facts + Frameworks)

The biggest barriers to a good discussion are our feelings. These feelings get in the way of listening and when you are not listening, you do not even know that you are not listening. Let me illustrate this with an experience.

I perform professionally as an Improv artist. In this kind of theatre, you go on stage with fellow artists and perform skits and long plays without a script. Listening is at the core of this art form. When you are creating the script as you perform, everyone needs to listen so as to be on the same page. When I train other improvisers, one of my favourite exercises is from the theatre legend Meisner. In this exercise, artists on stage repeat the last line of dialogue that they hear before coming up with their own dialogue. An example,

A: Should we go for a picnic? It is nice outside.

B: It is nice outside? The forecast was that it would be very hot.

A: The forecast was that it would be very hot? Well, right now it is not. I think we should take a chance that the forecast is wrong.

B: You think we should take a chance that the forecast is wrong. Hmm..I don’t know.

And so on.

This exercise may seem simple but is extremely tough even for experienced actors. You realise how little you listen only when you do this exercise. Actually scratch that. You realise how badly other people listen when you see them do it. It takes enormous effort to realise this about yourself. It took many videos of our shows for me to grudgingly admit to myself that I was as bad at it as many others.

Not listening in a discussion means that you are not learning anything new and it is our own feelings that are stopping you from listening. The subject of feelings is vast and I will restrict this post to only two of them. In my case the dominant reason for not listening is usually ego or a fear of looking foolish. For many other people, the reason is the need to be part of a tribe. I am a bit of an expert on the first one and so I will start with that.

Ego

Do you discuss to know more or to be right? I catch myself trying to be right in a discussion all the time and I am sure that I don’t catch myself many more times. As is well known, if you are trying to be right, then you wouldn’t be listening. Instead, you will be thinking of how to respond.

The other main reason for not listening is if what you are hearing goes against your identity.

I am a member of ___(Insert tribe)

Humans are social animals. We have a desperate need to belong to a group. The power of this feeling is best explained by a very short blog post from the guru Seth Godin which I have reproduced below in full

“People like us do things like this”

There is no more powerful tribal marketing connection than this.

More than features, more than benefits, we are driven to become a member in good standing of the tribe. We want to be respected by those we aspire to connect with, we want to know what we ought to do to be part of that circle.

Not the norms of mass, but the norms of our chosen tribe.

Seth Godin is talking about motivation to buy things. But this motivation is even stronger when it comes to believing things. I believe things because people like me believe those things. Because people I admire and respect believe those things. These beliefs are part of my identity and a part of what I aspire to be. In a discussion, I will stop listening if the facts or frameworks contradict the beliefs of my tribe. This is the reason that my social networks — FaceBook, Twitter, LinkedIn and even my networks in the offline world — will have like minded people and they will rarely do anything to weaken my beliefs.

The tribal tendencies get worse when the discussion is public. If you have witnessed a debate in a WhatsApp group, then you know what I am talking about — people desperately trying to signal their allegiance to a tribe and to show up the members of the other tribe.

To summarise, we have bad discussions because we do not share the same facts and frameworks. It is difficult to understand someone else’s facts and frameworks because our feelings get in the way. So how do we overcome these obstacles? One technique that can help is steelmanning.

Steelmanning

Many times in discussions, we distort our opponent’s arguments in an absurd fashion and then attack the distorted version. This is called strawmanning. As this article says, Strawmanning commonly takes the form of ‘So what you are saying is…’ and is very prevalent in TV studio ‘debates’. The opposite of strawmanning is to steelman. That is, to articulate your interlocutor’s arguments as well as you can.

A discussion can be very productive if you can articulate the opinions of others better than they can themselves.

However, steelmanning works only if all participants in a discussion are aware of the concept. More importantly, all participants should be in the discussion in good faith. They should be in the discussion to learn and not to reinforce their own certainties. It is very rare for these conditions to be met. Also, it is very cumbersome in casual discussion to explain steelmanning and then get the participants to use it. What can we do in such conversations?

The magic question

A question that can significantly improve the quality of a discussion is some variation of, “What would be the most reasonable case for a person to hold a view contrary to yours?” Let us illustrate this with an example.

Say you are an Indian like me and you are in a conversation with a friend from the United States. Your friend lives in a coastal city and is upset with his fellow Americans for voting for Republicans, specifically Trump. You can ask him the question,

“Nearly 75 Million voters voted for Donald Trump. What do you think are the most reasonable reasons for those voters to have made this decision? You can leave aside the people you think may be racist or low information voters.”

This is a brilliant question at many levels. It is a simple way of asking others to steelman what they are arguing against. The question also forces people in a discussion to think for themselves of possible opposing points of view. When people think of opposing points of view themselves rather than being told by someone else, there is a higher chance that they may think them legitimate. Finally, the answer to this question will help you quickly get out of bad political discussions. I got this question from Michael Malice and he described it as the main benefit.

This question does not come without drawbacks. Many people have not thought of why someone could hold a view contrary to theirs. Thinking about it can cause severe cognitive dissonance and that person could get very angry with you. Also, they could find you condescending for asking this question. There is an even bigger problem.

You have to answer the question yourself! Even your opinion rests on facts and frameworks that you probably don’t recognise and your feelings don’t let you listen to alternate points of view. To use this question on others, you need to be brave enough to use it on yourself. I believe something. Can I see how a reasonable person may come to a totally different opinion?

The few times I have tried to answer this question, I have found that I cannot immediately articulate why a reasonable person may have a different opinion. When I do succeed in articulating an opinion different from mine, my certainty about my own opinion drops. It is psychologically difficult to be in a state of low certainty about too many things. Especially, when the rest of the world seems to be absolutely sure of their opinions.

But then, if I cannot articulate any opinion other than mine, how much is my opinion worth? Not much I would say.

How do you make a discussion better? Do reply. Preferably in the comments section in the blog itself.

What we have written has been understood by wise people since ancient times so we don’t claim originality on any of this. However, we have practised the techniques that we are recommending and we know that they work some of the time. We recognise that we are often the reason why a discussion goes bad.

Our thanks to Manish for his suggestions and to Rajani for proofreading.

Yogesh: If you wish to stay in touch with my writing, follow me on medium. Click on the envelope icon to get your stories delivered in your Inbox. You can follow AskHow India (@AskHowIndia) or me (@YogeshUpadh) on twitter or on LinkedIn

Telegram channel: https://t.me/YogeshUpadhyaya

Anurag is wise and stays away from social media most of the time.

Author –

Yogesh Upadhyaya

(Yogesh Upadhyaya is one of the founders of AskHow India. Blogs are personal views.)

You can follow AskHow India (@AskHowIndia) or me (@YogeshUpadh) on twitter or me on LinkedIn or Medium. DM me if you wish me to put you on WhatsApp distribution list.

0

How to communicate complexity? Five tipsfeatured

April 25, 2022

Does your job require you to explain complex concepts? You could be a researcher, a manager or a student and chances are that you struggle with helping others understand your work. I can help. I have been explaining complex economic, technical and social issues for many years. Here are five things that I have learnt.

1. You know more than you realize

I am the founder of AskHow India. We take complex issues and simplify them for common citizens. It takes us months to understand a subject. We may read scores of documents and talk to tens of people. By the end of this process, we forget how little we knew when we started. We have to remind ourselves to say things that have become ‘obvious’ to us. If we don’t do this, our audience would not understand what we are saying. This is called curse of knowledge. Let me take an example.

I used to wonder why we have not been able to clean rivers in India in spite of spending billions of Dollars. When we dived deep into the subject, we realized that the problem was twofold. First, we don’t effectively clean the sewage and the industrial waste that flows into our rivers. For variety of reasons, this is a hard problem. The second problem is harder. We take away most of the water from the rivers for agriculture. The trickle of water that remains gets dirty very easily. Solving this problem is tougher as the livelihood of crores of farmers depends on this water.

It is obvious that taking away more than 90% of water from rivers makes rest of the water filthy faster. However, I didn’t know that agriculture took so much water just a few years ago. I have to remind myself to state this ‘obvious’ fact every time I talk about clean water.

Chances are that your audience knows very little about what you do. They may not know what is obvious to you. Start from the basics.

2. Use metaphors

Many people believe that the police in India is inefficient, politicized and corrupt. One of the main reasons is that police forces are organized similarly to military. Constables, who form the bulk of the force, only get one promotion in their career. How would you communicate this information so that your reader understands it quickly?

A metaphor is a great way of explaining concepts. A visual metaphor is even better. Most of us require periodic acknowledgment and appreciation to be motivated. If you had a job where you could get a promotion only once in four decades, the chances are that you wouldn’t be very good at the job. It would be as if you climbed a single mountain all your life and could reach the peak only once.

3. If you are trying to tell your audience something new…

If you are telling someone something new, start with something they know. Scott Adams calls it pacing and leading. Agreeing with someone creates empathy and allows them to be receptive to whatever new that you are telling them. Let us take an example.

Do you love renewable energy? So do I! Solar or wind electricity plants do not pollute the environment like coal fired plants do. There are many other benefits too. However, solar and wind energy impose a lot of hidden costs on electricity grid. One of the big reasons for this is that a grid operator needs back up for these plants. After all, the customers need electricity even when sun is not shining and wind is not blowing. When we wrote our piece explaining all the hidden costs of intermittent renewable energy, we started by acknowledging all its benefits.

The audience knows the benefits of renewable energy but they need to know that we know them too before they are ready to listen to us.

4. Create catch phrases

Simplifying complexity is not enough. Your core message should be memorable. Creating catch phrases helps. Another example.

How can the income of a small farmer increase? A few years ago, when we were trying to answer this question, we realized that the crop yield for many farms is low. The additional big challenge the farmers face is that they get a low price for their crops. So, to increase the farming income, we need to help farmers increase their yields and also help them get a higher price in the mandis. Our presentation of this framework before diving deep into it?

A farmer can increase his income if he “grows more & gets more.” Catch phrases like this stick. Such communication techniques, and our understanding, made this one of our most popular presentations. Even experts in the field, like professors and deans of agricultural universities, regularly download it.

5. Repeat without boring your audience

Even if your communication is very clear, most of your audience would have forgotten what they learnt in a few days. You have to repeat yourself. How do you do that without boring them?

This is a tricky one. You can be opportunistic and promote your work whenever the issue becomes ‘hot’ in media. For example, when the farmers’ protest in India gained a lot of attention, I cowrote this piece which has become my most read one. Or you could change formats. I have written sixteen blog posts on population in India. The key messages of these posts were summarized by my colleagues at AskHow India in this beautiful presentation. Or you could embed the messages in a topic that is very different from what you usually write about. For example, you could write a note on communication tips and use parts of your message as examples. Is it sneaky? I think not, if your main objective is to genuinely help your audience and if you are honest about your secondary objective.

Which techniques have you used to communicate more effectively? Do share that as a comment on this blog.

As a part of AskHow India, I try to simplify complex economic, social and technical issues. I occasionally also write about entrepreneurship.

If you wish to stay in touch with my writing, follow me on medium. Click on the envelope icon to get your stories delivered in your Inbox. You can follow AskHow India (@AskHowIndia) or me (@YogeshUpadh) on twitter or on LinkedIn

Telegram channel: https://t.me/YogeshUpadhyaya

Links to our work referenced in this post.

1. The hard problem and the very hard problem of cleaning Ganga

2. Renewable energy — not ready for prime time, yet.

3. How can a small farmer’s income be increased?

Author –

Yogesh Upadhyaya

(Yogesh Upadhyaya is one of the founders of AskHow India. Blogs are personal views.)

You can follow AskHow India (@AskHowIndia) or me (@YogeshUpadh) on twitter or me on LinkedIn or Medium. DM me if you wish me to put you on WhatsApp distribution list.

0

Want to make it easier for business? Make energy cheaper! (REODB 5)featured

April 09, 2022

Running a business is easier if costs are low. This is something I learnt as a cofounder in my company. The lesson was reinforced two years ago, when I met nearly fifty business leaders across the country and talked to them for hours about their businesses. It seems obvious that lower costs would make it easier to operate a business. Yet, the now discontinued Ease of Doing Business ratings of the World Bank, did not consider costs! Since our series is on Real Ease of Doing Business (REODB), we would be writing on some of the major costs for businesses in our next few posts. If India can reduce these costs, more businesses will flourish. Our first post will be on cost of energy. The cost of energy for businesses is much higher that it could be. Before we look at the underlying reasons, let us consider if cost of energy matters.

Does cost of energy matter?

The cost of energy is crucial for some businesses and not so critical for others. On one end of spectrum is Aluminum smelting. The cost of electricity is the most crucial cost in this process. That is why Aluminum smelting plants are located next to cheap sources of electricity. On the other end of the spectrum are high value businesses such as software. Electricity costs are a very small proportion of their total costs. Many businesses fall in between, where energy costs are of significant concern but are not the biggest one. Let us look at some examples.

I was surprised to find out that electricity cost was the second biggest cost for a coworking space that I worked in. The same was true for a theater that hosted live shows. Air conditioning costs a lot. Energy costs are critical for many small and informal businesses too. Alok picks up clothes from my home, irons them and brings them back. In my conversations with him, he has mentioned electricity bill as his biggest expense. For all these businesses, if the energy costs were lower, they would have a higher chance of thriving and employing more people.

Electricity is not the only form of energy used by businesses. Manufacturing steel in blast furnaces and manufacturing cement may use coal directly. The most widespread use of non-electric energy is in transport. Businesses transport their goods to customers using fossil fuel powered vehicles. Also, their employees use fossil fuel-based vehicles to reach their place of work and these costs can be very important for the businesses. In this post, we will begin by looking at the cost of fossil fuels, but first, a few words on methodology.

In this piece, I have not used price comparisons across countries. Rather, I have shown that businesses have to pay a lot more for energy because of government interventions and inefficiencies. I believe that cross country comparison is of limited value when thinking about Real Ease of Doing Business. This is true because of two reasons. First, most business are focused domestically and international comparisons do not make sense for them. For example, a theater owner in Mumbai does not care if she pays less for electricity than her counterpart in Berlin. All she knows is that a high bill for energy leaves less money for her employees and for her bottom line. Secondly, as a country we want more and more businesses to flourish so that many more people get meaningful employment. We should be using all the advantages we have and not get bogged down thinking about whether some other society across the globe has more or less of such advantages. That kind of thinking is best left to academics unless you are looking at a select few globally competitive businesses.

Coal is the biggest source of energy in India and we begin with that.

Why is coal more expensive than it could be?

India meets most of its energy requirements from coal. According to Coal India, 55% of energy requirements of the country and 69% of electricity requirements are met by coal. [1] In 2020–21, Coal India Limited contributed nearly 42, 000 Crores by way of duties, Royalty, GST and other taxes and levies. Additionally, the company paid Rs. 5,300 Crores of Income Tax and made dividend payments of Rs. 7,700 Crores. Note that the price of coal is fixed by the government at a high level so that Coal India Limited is in a financial position to pay the Income Tax and the Dividend. Total amount of money that the central and state governments got from the company was more than Rs. 50,000 Crore.

Note that CIL accounted for 83% of country’s coal output and governments would extract money from other producers too. Also, note that 2020–21 was a slow year for the company and in previous years, the amount of money that the governments got was at least 20% more. Also, note that India imports a significant quantity of coal and the importers of this coal have to pay import duty on it. In 2020–21, India imported 215 MT of coal worth Rs. 1,16,037 Crores.

Businesses that use coal directly — such as steel and cement producers — have to pay a higher cost for their ingredients than it would have been the case if all these taxes and levies were not imposed. Coal is used to produce electricity and high price of coal directly means high cost of electricity.

The contribution of coal sector to government finances is huge. However, it does not look big when compared with the contribution that petroleum products make. Let us look at that next.

Why are petroleum products more expensive?

Hindustan Petroleum publishes the breakdown of pump prices in Delhi. I have given this breakdown as of March 16th

Government taxes form a very high proportion of the final price to the consumers. Note that the proportion given above does not include any taxes that would have been charged on import of crude and on production of domestic crude. Also note that the price at petrol pump is higher in most other states as the state government taxes in those states are even higher. The oil sector also contributes to the central government by way of dividends and income taxes and prices are fixed to ensure a large flow to the government.

High taxes and duties on Petroleum products are charged because governments in India depend a lot on these to balance their budget. According to Ministry of Petroleum and Natural Gas, the contribution of petroleum sector to the central exchequer was Rs. 4,55,069 Cores in 2020–21. According to the Revised estimates for 2020–21, total receipts of the government of India (without borrowings) were Rs. 16,01,650 Crore. The contribution of petroleum sector to this was nearly 30%! The contribution of the sector to the state exchequer was Rs. 2,17,650 Crores.

Of course, not all of these taxes were charged to businesses, but there is no doubt that businesses would pay much lower amounts for buying petroleum products if it were not for the high dependence of government finances on petroleum sector.

Edit 1: Note, that businesses cannot get tax credit for indirect taxes paid on petroleum products unlike the credit they may get on GST paid on other inputs.

As an aside, there is a lot of talk of imposition of Carbon tax to help tackle climate change. While India does not call this humongous contribution of fossil fuel to the exchequer as Carbon Tax, the taxes and the high prices act as a deterrent to the use of fossil fuel and act as Carbon taxes. In that sense the country must have one of the highest carbon taxes in the world!

The energy source that virtually every business uses is electricity. The cost of electricity is much higher for businesses than it could be. Let us look at that next.

Why is Electricity more expensive than it could be?

Commercial and industrial customers are charged at a much higher rate than domestic and agricultural customers.

We have seen that the price of the main source of electricity — coal — is much higher than it could be because of the contribution that coal makes to government finances. There are other reasons for the high cost of electricity. These are

· A lot of electricity made from expensive coal is lost (Technical losses) and also because many customers do not pay their billed amount (Commercial losses)

· India has made many uneconomic decisions in the past and hence, we transport coal over long distances rather than transmitting electricity.

· The cost is likely to go up in future with induction of renewable energy.

The burden of this high cost falls disproportionately on commercial and industrial customers as they cross subsidize agricultural and domestic customers.

Let us look at each of these factors in turn.

Aggregate Technical and Commercial losses

The efficiency of distribution companies in India is measured using the Aggregate Technical and Commercial Losses (AT&C). This measure combines technical losses and commercial losses. The AT&C losses for 2019–20 were 20.93%. Revenue foregone because of each percent of AT&C loss is approximately five to six thousand Crores!

The high AT&C losses is the big reason for the cost of electricity being much higher than it could be. There are other reasons too. One of the more insidious ones is the location of our power plants.

Uneconomic decisions made

As discussed, more than two thirds of electricity generated in India is from coal fired power plants. The coal for most of these plants comes from coal fields in the Eastern part of the country. It is costlier to transport coal than to transport electricity. However, for various historical reasons, we have coal power plants based in as far-flung states as Haryana and Punjab and the cost of electricity generation from these plants is higher than if the same plants were located near the coal mines.

That is not all. Domestic coal shortages have meant that we have imported coal and transported it to distant Uttar Pradesh! There is a government of India policy to reverse this import of coal. I am not sure however, how successful it has been.

Even as we pay for the uneconomic decisions of the past, we are currently implementing policies that will further increase the cost of electricity in years to come. Renewable energy — being aggressively inducted in the Indian grid — will increase the cost of electricity. Let us look at that next.

Renewables — driving the cost of electricity higher

Renewable energy already makes electricity more expensive than it could be and as we increase the proportion of electricity from wind and solar energy, the price of electricity in our grid will increase further. Let me explain.

Distribution companies contracted with solar and wind energy producers in the past years at high tariff. As per those contracts, the distribution companies are bound to buy electricity from these companies whenever they are producing it, even if they have cheaper alternates available. In fact, regulators specifically force them not to curtail supply from renewable sources.

Many of these contracts are from the time when renewable electricity (solar energy specially) was much more expensive than it is today. With the falling cost of renewable energy, is this problem solved? No. To understand this, we need to understand the true cost of renewables.

Consider a grid which has a maximum demand of 1,000 MW. Suppose that the grid has 6 coal plants of 200 MW each to meet the demand. Why 6 and not 5? Because, power plants need to undergo maintenance and if the grid operator wishes to meet all customer demand, then the total supply needs to be more than the demand. Now what happens when say 200 MW of new solar energy comes online? Can we ‘retire’ one of the old coal power plants?

Not if the peak demand in the grid comes at a time when the solar power plant cannot produce electricity. In Indian grids, the peak demand for electricity comes in the evening hours when the sun does not shine and there is no possibility of solar generation. What this means is that the grid will need to pay the coal power plants for their capital charges even as they tell them not to generate in the day because they will be needed at night.

Note that it gets worse as the demand in the grid rises. Presumably, the peak would still be in the evening and supply is being added in the afternoon. To meet the demand then the grid will need to add thermal generation too. So, the grid will pay for capital charges of thermal plants and pay for electricity charges of solar plants. We have explained this concept in detail here but this metaphor explains the problem well. If your wicketkeeper in a cricket team is not good, you need to keep a backup fielder and that imposes costs for the team.

Note that a grid may need to cater to not just daily variation in supply but also to variation across seasons. In monsoon months the solar plants will not generate electricity and the grid would need thermal plants for backup. They would have to pay the full capital charges of these plants even if they are backup. Note that the cost of storage of electricity is very high and hence is currently not a practical option. Additionally, renewable energy also imposes technical costs on the grid which increase the cost of electricity further.

The cost of electricity is higher than it could be due to high price of coal and due to AT&C losses and uneconomic decisions. The burden of this high cost falls disproportionately on industrial and commercial customers. Let us look at that next.

Cross subsidy

As we saw, the electricity rates for industrial and commercial customers are way more than those for domestic and agricultural customers. This is true across the country. In a few states electricity is free for farmers and for very poor households. In many others, it is unmetered and provided at a flat rate. The utilities providing this free electricity are compensated by state government subsidy and by charging a higher tariff to industrial and commercial customers (Cross subsidy). Anytime the cost of electricity increases in the country, the burden is taken disproportionately by businesses. That is, a cost increase will fall much more on businesses and on state government subsidies than it does on agricultural and poor domestic consumers. This is true across states as this table shows

Note that I am not arguing here whether poor people and farmers in India should or should not get electricity at subsidized rates. All l am saying is that when businesses — that is industrial and commercial customers — have to bear the burden of high cost of power, their Cost of Doing Business is higher than it would otherwise have been.

Edit 2: Note that businesses cannot get input tax credit for electricity duty unlike the credit they get for other inputs.

Edit 3: Many businesses need to keep a back up electricity supply system because of unreliability of grid supply. This imposes even more costs on those businesses.

Summary and discussion

Energy in India comes mainly from coal and petroleum products. Businesses use coal directly or they use electricity and most of electricity is generated using coal. Businesses also use petroleum products. The energy cost for business is much higher than it could be because

· High taxes and duties on petroleum and their high prices that allow governments to get Income Taxes and Dividends from companies selling petroleum products.

· High taxes and duties on coal and its high price that allows government to get Income Taxes and Dividends from companies selling coal.

Additionally, electricity is expensive for businesses because

· Electricity distribution companies have high Technical and Commercial losses. This takes the cost of electricity up and the burden of this cost falls disproportionately on business customers.

· India has made many economically bad decisions when it comes to electricity. For example, we have power plants in North of the country and coal has to be transported thousands of kilometers to generate electricity there. Generating electricity near coal fields and transmitting electricity would have been much cheaper.

· As India increases the share of renewable energy in its grids, the cost of electricity is likely to go up even further. This is because renewable energy generates electricity sporadically and the demand is round the clock. Grids need to keep excess capacity or store electricity and both of these are costly.

· Agriculture customers and poor domestic customers get free or cheap electricity. The tariff for business customers is kept high to cross subsidize them.

What can the country do to keep the cost of energy low for businesses?

· The simplest answer is to reduce taxes and duties on fossil fuels. It is easier said than done though. This is because governments — at center and state are addicted to the contribution from fossil fuel to balance their budget. I believe however, that the country should make a commitment to providing cheap energy and try to wean itself away from this addiction.

· Electricity distribution companies should clean up their act. This problem is well understood but the solutions are not well implemented. Some of the measures for reforms are

o Reduction of AT&C losses.

o Clear separation between power utility and state.

o Metering consumption of farmers and domestic consumers even if the state decides to provide free electricity.

o Thinking carefully about how they can mitigate the excess costs of renewable energy in the grid. Shifting demand, from evening to the times when renewable generation is maximum, should be strongly encouraged.

Underlying all these measures would be a policy goal to keep energy costs low for businesses. You could point out that a low cost of energy cannot be the only goal for energy policy in India. That is correct. Energy independence is important. So are environmental concerns arising from consumption of fossil fuels. However, as things stand today, we are not meeting any of these goals. We depend mainly on fossil fuel for most of our needs. Most of this fossil fuel is imported. Meanwhile, our businesses pay a high price for energy using up precious money that could have been used for employing people or for expanding the business. A coherent policy that acknowledges these failures would be a small start to setting this situation right.

[1] I have used different sources for data across this post. Also, the data is for different years. This is based on ease availability. A different data source may have significantly different figures and percentages. However, I believe that unless the difference is drastic, the direction of my arguments would not change.

My heartfelt thanks to Neeraj and Manish for helping me understand energy sector better. Thanks also to Rajani for proof reading and catching a million mistakes. Errors mine.

Edit 1 and 2 clarifications made in response to comments received from Deepak. Edit 3 on the basis of comments from Sunay. Thanks to Shankar for clarifying my understanding of indirect taxes on petroleum products and on electricity duty.

Author –

Yogesh Upadhyaya

(Yogesh Upadhyaya is one of the founders of AskHow India. Blogs are personal views.)

You can follow AskHow India (@AskHowIndia) or me (@YogeshUpadh) on twitter or me on LinkedIn or Medium. DM me if you wish me to put you on WhatsApp distribution list.

This is the fifth article in a series on Real Ease of Doing Business (REODB). The first four articles can be found here

1. The local bullying of business .

2. How is China so welcoming of business.

3. Ease of Doing Business — Searching under the lamppost.

4. How can the tax departments be less taxing?

0

Punjab will be a very different challenge for AAPfeatured

March 13, 2022

The election results in Punjab may have reminded the Aam Admi Party (AAP) of their sweeping victory in Delhi, but the challenge of running the government would be very different. If governing Delhi, was like life for a DINK — Double Income No Kids — couple, governing Punjab would be the equivalent of SINK — Single Income Numerous Kids.

Image by mohamed Hassan from Pixabay

The task of governing any state is not easy. Delhi governments have the additional challenge of dealing with the central government that may not always share its point of view. That said, governing Delhi has two big advantages. The state can generate a much higher level of tax revenues and it does not have many of the expenses that most other states do. It is a double income state with no responsibility for some crucial sectors. Let us first look at the tax revenues of Delhi.

State governments in India get their tax revenue mainly from their share of Goods and Services Tax (GST) on all goods and services and from Sales Tax on fuel and alcohol. More goods and services are consumed in urban areas than in rural areas. Delhi is mainly urban and hence it is natural that its tax revenues are much higher than of rural states. Delhi has an additional advantage — the spending of Central government.

The Central government has many offices and employees in Delhi. Then there is the Delhi Cantonment with numerous army personnel. Additionally, a significant portion of central police forces is based in the city. The spending on these generates additional taxes for the state government. A central government employee buying a car in Delhi, would be giving the state government significant amount of money as State Goods and Service Tax (SGST). When the army builds a new building, it would give significant money to the state government by the way of SGST on steel and cement. So not only does the Delhi government get the advantage of governing a predominantly urban area, but also it gets the benefit of a lot of spending of central government.

This ‘double income’ advantage is reflected in Delhi’s tax collections. The GST collection of Delhi is many times higher than that in much larger states. As this link shows, the GST collection in Delhi was the ninth highest in the country. It beat many large states such as Rajasthan and Kerala. Punjab came in at 17th.

The higher tax income is not the only advantage in governing Delhi. It also has the benefit of not having to undertake spending on areas that other states need to. One of the major spending that Delhi does not have to do is on policing.

Delhi police comes under the central government. While this severely curtails the potential political impact of a Delhi CM, it also gives the state a big benefit in its budget. In 2021–22 the Central government budget allocation for Delhi police was more than 8,500 Crore. That was approximately one eighth the total budgeted expenditure of the state! Land use in Delhi is under the Central government and hence a lot of spending in the capital does not come from the Delhi budget. However, the biggest expense advantage for Delhi in my view, is not having to spend on agriculture and rural development.

Governments have to spend a lot of money on rural areas. This expenditure could be on public works to support agriculture, such as irrigation canals and dams. Or it can be for price supports or subsidies for inputs such as electricity. Additionally, providing basic services in villages can be more expensive than providing the same services in urban areas. A primary Health Centre (PHC) in a densely crowded Delhi slum would take care of many more people than a PHC in a relatively sparsely populated village. Hence, the per person cost of providing a PHC would be lower in urban areas than it is in rural areas. This would be true for many other amenities such as schools.

This advantage in governance of mainly urban centers as compared to governing larger areas with significant rural populations is well understood. The book ‘How Asia Works’ talked of the relative ease of governing small city-based countries such as Hongkong and Singapore with larger countries and this is what it had to say

‘Offshore centers are not normal states. Around the world, they compete by specializing in trade and financial services while enjoying lower structural overheads than other countries, which have larger, more dispersed population, and agricultural sectors that drag on productivity. Offshore centers’ lower overheads mean that they also have a bult-in fiscal advantage. Yet, they can never exist in isolation — they are in a strict sense parasitic, because they have to have their host or hosts to feed on.’

Delhi does not have the responsibilities that other Metros like Mumbai and Bengaluru have. It is free of any economic ‘drag’ that rural areas impose on these Metros.

The DINK status of Delhi would have meant that governing any other state would be tougher. What compounds the problem for AAP is that Punjab is not a particularly well governed state. Not only is it a single income state, but also many of its sectors are in poor shape. It is a Single Income Numerous Kids state and many of its kids are old, cynical and worn out.

As I discussed here, Punjab has done particularly poorly in the last few decades. In 1980–81, it was the state with the highest per capita Net State Domestic Product (NSDP). NSDP is a measure of income of the state. Now it has dropped out of top five. The problem of its farmers came into sharp focus when many of them protested near Delhi for months. Farmers in Punjab are stuck growing crops that they sell to the Central Government at Minimum Support Prices — an arrangement that is not sustainable. The state also faces significant law and order challenges. Additionally, the state has been mismanaged for some time now and is much more indebted than most states. In 2019–20 [1], the debt servicing burden of Punjab was Rs. 57, 741 Crores and its Tax revenues (including its share of central taxes) was Rs. Rs. 40,341 Crore. The debt servicing burden of Delhi was just Rs. 6,139 Crores when its tax revenues were Rs. 36,566 Crores.

The fact that governing Punjab will be more difficult than governing Delhi does not necessarily mean that AAP would not be able to do it. It is just that they will have to do a lot of learning on the job. What worked in Delhi may not work in Punjab. However, great politicians and administrators are able to adjust to changed circumstances. By their huge victory in Punjab, AAP has shown that they are very good politicians. I hope that they are able to show that they are great administrators too. The state and the country would be better off for that.

[1] I have used the 2019–20 figures as they were least impacted by Covid-19.

My thanks to Madhavan for helping me understand finances of Delhi and Punjab. Views and errors mine.

Author –

Yogesh Upadhyaya

(Yogesh Upadhyaya is one of the founders of AskHow India. Blogs are personal views.)

You can follow AskHow India (@AskHowIndia) or me (@YogeshUpadh) on twitter or me on LinkedIn.

This is the third post in a series, State Wise, where I compare the economic trajectories of different states of India. The first two are

1. Why is Uttar Pradesh Such an economic laggard?

2. Indian States — The superstars, the laggards and the mighty fallen

0

What can data tell us about modern India?featured

March 09, 2022

I know I am going to get some dirty looks for saying this, but I read non-fiction books with a pen in hand. I underline the sentences that I like. I mark references for future. Worst of all, I make notes in the margins. I recently read the book — Whole numbers and Half Truths — and my copy is one of my more underlined and scribbled upon books. There are appreciative ‘Aha!’, there are sentences double underlined for extra emphasis and there are questions. A lot of questions. The book does justice to the title and there is a wealth of data in it. However, I am not sure that I always agree with the author when it comes to the subtitle: What data can and cannot tell us about modern India. In this post, I will take up some of the things I liked about the book and also a few of the places where I had questions or disagreements. Let us begin with the part where the book really shines.

The Aha! moments

I am a fan of the author Rukmini. I first came across her work in The Hindu. In a three part series, she analysed nearly 600 judgements in cases involving rape in Delhi’s seven district courts. The insights she gained from this painstaking work are shared in the first chapter of the book and are easily worth its price. So many enlightening passages! For example, why do we see headlines of girls abducted using ‘sedative laced cold drinks’? Turns out that it is because many of the rape cases are actually cases of consensual elopement. The family of the girl objects to this relationship — often for caste or community reasons. To show that the girl was taken away against her will, the family members allege that she was given a ‘sedative laced cold drink!’

I get immense pleasure whenever I understand something about the world that I could not even have guessed. Rukmini’s work has many such insights. Clearly she read all court judgements in Delhi and talked to many people. This told her what the right questions could be and she created the data categories to answer the questions. For example, how many of the rape cases are actually cases of family objecting to a consensual elopement?

Unfortunately, the right questions have not always been asked in the book. Let us take urbanisation as an example of this.

When data is not asked the right question

Early in the chapter on urbanisation is the statement

‘Even today, the median Indian lives in a village’.

This is true by the very strict definition that the Indian census uses to classify a habitation as a town. According to census, a habitation is a town if more than 5,000 people live in that habitation. And the density of population is more than 400 / square kilometre. And at least 75% of the male workforce is engaged in non-farm work. Such a strict definition is not used everywhere in the world.

In a paper published by IDFC institute, Tandel and others have used less strict definitions and found that more than 50% of India already lives in urban habitations. So, which definition should we use to assess the extent of urbanisation in the country? It depends on why you are interested in urbanisation.

If you are interested in economic development, you would note that urban habitations are generally more prosperous. Among other reasons, this is because

· Many more people live in an urban habitation than they do in a rural habitation. What is more, these people live closer together. This allows more businesses to become viable in an urban area. For example, a chai shop in a densely packed slum will have more potential customers than a similar shop in a well spread out village with very few families.

· Many people in a village are occupied in agriculture. In general, agriculture pays less than occupations that are found in urban settings. This makes the business of our tea stall owner in a village even less viable.

What is the lowest population point at which businesses are viable? Of course, there is no one answer. But as income levels increase, the same business becomes more viable at lower population levels and density. So from an economic development point of view, we should be using less strict definitions than we have been doing for decades.

The complexity does not end here. If you were interested in employment opportunities that urban centres provide, you could consider how far away does an individual live from them. Partha and others did just thatand found that even in 2011, more than 50% of Indians lived less than an hour away from an urban centre. Incidentally, the statistic was only 36% in China at the same time. I have covered urbanisation in India here.

Let us take another example of questions not asked. The issue of female foeticide.

India has a very low Sex Ratio at Birth (SRB). The ‘natural’ SRB is between 942 and 953 female births for every 1,000 male births. Any ratio lower than that, and it is likely that there is sex selective abortion in that society. Some couples go to doctors to determine the sex of their foetus and abort it in case it is a girl. Technologies for determination of sex of the foetus — such as ultrasound — started becoming widely available in mid 1980s. Since then, the SRB in India has fallen below 910. This practice is illegal but widespread across the country. States in North of India are much worse than those in South and Haryana was a particularly bad case. NITI Ayog reported that in 2014- 2016, SRB in Haryana was 832!

In recent years, the government of Haryana has claimed that it has starting reversing the decades of low SRB in the state. The data that the government uses to back its claims comes from Civil Registration System (CRS). Not everyone trusts it. Whether the state has actually made progress or not is a debated topic. I have covered it in three posts which can be found herehere and here. My conclusion, based on my interaction with government officers and neutral observers, was that I was optimistic. However, I do not have a high degree of confidence in my optimism. Hence, I would have loved to know Rukmini’s view on this as she has studied the CRS system closely in the context of Covid deaths. The book covers female foeticide but does not talk about Haryana.

In the two examples, we saw that it is important to ask the right questions if we want answers from data. There are some situations however, when data cannot answer even if we ask the right questions. Let us take the issue of employment as an example.

When data cannot answer important questions

At AskHow India, we have spent a lot of time trying to understand employment. If I were to share one insight, it would be — People look for Acchi Naukri (regular salaried job with ‘good’ pay and status) and not just kaam(employment). Most of the country’s employment measures don’t tell us anything about Acchi Naukri. There are other problems too. Let me explain with a made up example.

A farming family has a small piece of unirrigated land. They grow one or two crops a year depending on rainfall. The family grows enough grain for their yearly needs but has very little surplus for sale. They also have a small kirana (grocery) shop in their home in the village. The woman of the house tends to the shop when the man is in the field. When he comes back he sits in it. The shop does not make profit. The couple has two sons and one daughter. One of the sons helps his father in the field although the father does not need too much help on most days as the land holding is very small. The other son goes to Mumbai and works at construction sites for a few months every year. He works extraordinarily hard for the few months and for the rest of the time, he relaxes at home. The daughter helps her mother in domestic chores and in collecting firewood and animal feed. She also helps in the field at times. Most of the cash income of the family comes from the son’s construction work. And yet, our employment statistics would consider the father fully employed and the construction worker son partially employed. Collection of firewood and animal feed would not be considered as employment even though the cattle makes money for the family. The work of running the household is also not considered employment, as it is not in most countries.

This example barely begins to illustrate what is hidden behind the headlines that talk of quarterly employment numbers being higher or lower. If the construction worker son cannot get opportunities in Mumbai he would stay in the village. If a surveyor asks him about employment, he may reply that he works in the field or the shop to avoid embarrassment. The same field and the shop that did just fine without his help when he was in Mumbai. The data from the survey would show that his employment level has actually increased! This is when the cash income of the family has fallen sharply. How widespread is this kind of thing? We can’t say.

Before the pandemic, I went around the country and met around fifty business leaders. These leaders were owners or managers of businesses of different sizes in different sectors. Many of these leaders complained of high level of attrition in their blue collar workforce. One retail manager said that in her Mumbai warehouse, 40% of employees left their job every month! Her understanding was that many employees come with a target saving in mind and leave their job as soon as they achieve the target. This is rational thinking. Most blue collar jobs are not careers. They involve a lot of hard work for long hours. It makes sense for many people to think of them in terms of short term gigs. This is especially true for migrant workers because life in big cities can be very hard for them. And costly. Life in villages is easier and cheaper. So it makes perfect sense for someone to work hard for a few months and then go back home. This thinking is so well accepted that many business owners employ older, married folk in their companies knowing that they are likely to stay longer than younger people with fewer responsibilities. Again, how widespread is this? We don’t know and the data can’t tell us.

This is not all. For many people, salary is not the sole determinant of what is Acchi Naukri. For example, my interactions with skill trainers suggest that people prefer to train as data entry operators even when only one in hundred applicants gets that job. In comparison advertisements for sales job, even in good companies, do not get many applicants. Security and facilities management staffing companies note that the job of a security guard is preferred to any job in facilities management. To add to the complexity, people want a much higher pay for a job in a metro than for the same job in a smaller town.

The chapter on employment acknowledges some of these limitations of employment data. However, to me this acknowledgement does not correctly state how little our employment statistics tell us. The chapter starts with a discussion of the Modi government holding back the release of employment statistics prior to the 2019 elections. It ends with this sentence.

‘India’s jobs crisis is twofold — not enough jobs and suppressed data.’

No. India’s job crisis is a lack of Acchi Naaukri. Data, in the current form, however timely, will not help anyone achieve it.

Urbanisation, birth and employment are tough to measure. However, measuring beliefs is even tougher. Let us look at that next.

Where data gets really unreliable — measuring beliefs

The chapter on beliefs in my copy of the book is filled with questions. For example, here is the author on the results of a survey on attitudes towards democracy and authoritarianism

‘India, along with Pakistan and Russia, featured below the global average on the importance accorded to democracy.’

The immediate question that came up in my mind is how is that with similar attitudes, India has done so much better than Pakistan or Russia in preservation of democracy? Of all the countries that became independent after the Second World War, India is one of the very few that has remained democratic. Others are Belize, Jamaica, Mauritius, Papua New Guinea, Solomon Islands and Vanuatu — all tiny compared to India. So either the attitudes have not been measured well or they are not important. Or there is something different about India and it would be useful to know what that is.

Elsewhere, the author discusses the issue of tolerance and suggests that India is more intolerant than news headlines suggest. The following is a sentence from a section on a Pew survey finding that is supposed show that Indians may not be very tolerant.

‘A majority of Hindus in India see themselves as very different from their Muslim compatriots (66 percent) and most Muslims feel the same way, saying they are very different from Hindus (64 percent).’

It is not clear to me why the acceptance of differences is an indication of intolerance. In fact, you could argue that the question of tolerance does not arise unless there are differences! After all, what would you be tolerating if the person that you are tolerating is the same as you? The author has other data point in support of her assertion but then we come to the another question — how well were those data points collected? Take this one for example,

‘Even among Sikhs and Jains, who each form small minorities, a large majority said their friends came mainly or entirely from their small religious community.’

As I read this, I thought — where were the Sikhs polled? In Punjab or outside the state? If it was in Punjab then isn’t it natural that Sikhs said majority of their friends were Sikhs? After all, in large parts of the state, Sikhs form the overwhelming majority in a location. It is natural that most of those Sikhs have mainly Sikh friends.

To be clear, I am not commenting on the author’s point about the comparative tolerance of Indians and people of other countries. All I am saying is that some of the data she cites does not support her assertion. Additionally, I take survey data with a healthy dose of scepticism.

India, as everyone and their uncle will tell you, is a huge and extremely complex country. To draw a representative sample is very tough. If I talk to only kids in South Mumbai schools, I would believe that football is the most popular game in the country! Of course, people conducting surveys know the importance of drawing representative samples but their best intentions are defeated by the size and complexity and the cost and understanding needed to tackle it. Pre-election and even post polling surveys provide a great example of the challenge of drawing inferences based on surveys. If these cannot correctly predict the result of a single action like a vote, how can we trust them to tell us about such complex things as beliefs?

When the surveys are global, the complexities multiply. The reputation of the survey conducting body is absolutely no guarantee that the survey they conduct is any good. When I dived deep into the Ease of Doing Business surveys conducted by The World Bank, I was shocked to find how ordinary it was. Apart from a multitude of others ills, it was funny that the Ease of Doing Business survey did not even talk to businessmen!

Maybe the author has gone through all the surveys she has cited and has thought through all the questions that I have asked but has made the choice not to address them in the book for reasons of space. The book has ten chapters, each one very different, and hence covers a lot of ground. If the author had to answer all the questions that I am asking, perhaps the book would have become much bigger than she wanted. As a reader however, I would have preferred depth to breadth.

Buy the book. As I said, the insights from Rukmini’s own work are worth the price and your time. I realise that I have devoted way fewer sentences to the good work than I have to the work I have criticised, but that is because Rukmini’s work on crime and courts speaks for itself way better than I could. The rest of the book is also an easy read and is sure to tell things about India that readers may not be aware of. There is a chance though, that you also mark many of the same passages in your copy as I have. Data can tell us things about India only if we ask it the right questions and sometimes not even then.

If you have reached the end of this long post, then the chances are you are also interested in understanding India and in use of data to improve understanding. 

Author –

Yogesh Upadhyaya

(Yogesh Upadhyaya is one of the founders of AskHow India. Blogs are personal views.)

You can follow AskHow India (@AskHowIndia) or me (@YogeshUpadh) on twitter or me on LinkedIn or Medium. DM me if you wish me to put you on WhatsApp distribution list.

0

Indian States — The superstars, the laggards and the mighty fallenfeatured

February 09, 2022

Authors: SR Ramanujam and Yogesh Upadhyaya

Punjab and Maharashtra were economic leaders four decades ago. They are no longer in the top 5! Rajasthan used to be a laggard and now has climbed to somewhere in the middle.

Last week, one of us wrote a post on how Uttar Pradesh has been an economic laggard for a long time now. This prompted the other to wonder how different states have done over the past few decades. We downloaded the state wise NSDP per capita from RBI and made two charts. These charts have stories to tell. From the first one.

· How the mighty have fallen: Noticeable is the fall in the rank of Punjab, Maharashtra and West Bengal. The top two states of 80–81 are not even in the top 5 now!

· Rising stars: Karnataka, Tamil Nadu and Kerala have done very well to break into the top five. Haryana has jumped from three to one. Gujarat has done the tough job of maintaining its ranking. Rajasthan has also done well and is no longer a back bencher.

· Back Benchers: Bihar, Uttar Pradesh, Assam and Madhya Pradesh continue to trail the rest of the field.

The comparison is on NSDP per capita. It is in current prices which means that it is not inflation adjusted and part of the income gain will go in increased costs. Also, the figures for 1980–81 and 2019–20 are from different series. So, they are not strictly comparable. With these limitations, we see that even the backbenchers have grown quite a bit which is good news.

Why did the superstars outperform? Why did the laggards stay laggard? Why did the mighty — Punjab, Maharashtra and West Bengal — fall in rankings? These questions are beyond the scope of this small post. Indeed, many books should be devoted to studying the trajectories of Punjab and Maharashtra on one hand and Haryana and Tamil Nadu on the other. If you have thoughts on any of these, be sure to leave a comment! Remember, that we are talking of a timeline of four decades and explanations based on any single political party or an event may explain very little.

Note: The numbers for Uttar Pradesh, Andhra Pradesh, Bihar and Madhya Pradesh are not strictly comparable as new states were carved out of these in the intervening decades. Also, NSDP / capita is just one measure and states may legitimately judge their performance on other measures. We do think that with all the limitations, these charts have something important to say.

SR Ramaunjam can be found on Twitter (@SRRamanujam) and LinkedIn.

Author –

Yogesh Upadhyaya

(Yogesh Upadhyaya is one of the founders of AskHow India. Blogs are personal views.)

You can follow AskHow India (@AskHowIndia) or me (@YogeshUpadh) on twitter or me on LinkedIn or Medium. DM me if you wish me to put you on WhatsApp distribution list.

0

Why is Uttar Pradesh such an economic laggard?featured

January 29, 2022

The economy of Uttar Pradesh (UP) has grown much slower than that of Tamil Nadu (TN) for more than three decades. This was not always so. The two states grew similarly in the first few decades after independence. What it more, it is not easy to figure out why. These are the messages that I took from the book The Paradox of India’s North-South Divide: Lessons from the States and Regions. [1]

The book begins with the comparison of the per capita Net State Domestic Product (NSDP) of UP and TN. NSDP is a measure of economic activity and dividing it by the population makes it possible to make comparisons across states with very different populations.

As can be seen, the per person economic activity in TN was always higher than in UP. However, it was only in middle to late 1980s that the economic activity in the southern state started growing much faster than the Northern one. National policies changed significantly starting in late 80s and TN was able to take advantage of those but UP couldn’t. Why?

The authors have looked at human resource capabilities, urbanization, basic infrastructure, efficiency of resource utilization, governance including political stability and law and order and what they called demand factor arising out of social mobilization as factors to explain the performance between UP and TN. However, to me some of the explanations are less enlightening or convincing compared to others. [2] Let us first look at the not so convincing ones and begin with the literacy ratio.

The authors point out that the literacy ratio in TN has always been higher than UP and that may have contributed to TN’s breakout performance. But the literacy in both states has been increasing and the rate in UP in 2000–01 was higher than it was in TN in 1980–81. So, if literacy was the driving factor, then UP should have started closing the gap in the recent years! It hasn’t.

Take another example, technical education. The authors first wondered if the number of graduates was an explanatory factor. But they found that UP had a higher proportion of graduates than TN! So, the authors speculated if it mattered if the graduates were getting technical degrees rather than basic degrees in arts, science and commerce. They found that the proportion of students enrolled in technical courses was indeed higher in TN. But to me it is not clear which way the causality runs. Are more technical graduates in TN causing better economic performance? Or is the better economic performance creating a higher demand for graduates of technical courses?

Another factor that looked promising initially was political stability. The authors have used tenure of the Chief Minister as a proxy. They say that between 1967 and 1985, UP saw 18 CMs and periods of President’s rule. In contrast the CM changed only three times in TN. The tenure of CMs in UP increased after that and in TN it reduced slightly. However, the gap between them was still large. Between 1984–85 and 2008–09, the average tenure of CM in TN was 1,058 days and was only 390 days in UP. The book was published in 2015 and the much of the analysis is for periods before that. Have things changed since?

Indeed, they have. UP has seen a remarkable stability in tenure of CMs in the last fifteen years. The last three CMs — Ms. Mayawati, Mr. Akhilesh Yadav and Yogi Adityanath — all completed their full term. The average tenure for CMs for last 15 years is more than 1500 days! But did this make a difference? No, as I will show later in this post.

One of the factors that had some explanatory power was demographics. Here is another interesting chart from the book.

As we can see, in 1980s the ratio of young working age population and children in TN started increasing as the number of children per woman reduced a few years before that. As a consequence, the state had more and more working age adults as compared to children and by the end of comparison period, young working aged folk was more than children. Many of these working age folk would have sought employment and would have got it. Even if the employment was not very productive, the state NSDP per person would have increased faster than it did in UP. This is demographic dividend. Of all the factors discussed by the authors, I found this most convincing.

Two other interesting factors examined by the authors were the Law-and-Order situation and what the authors call demand factor. Based on discussions, the authors concluded that a relatively peaceful law and order environment, presence of good work culture, promise of good infrastructure and proximity to ports led to industry locating in TN. I have had discussions with business leaders across the country, and this seems right to me too. However, it begs the question — why could TN fix its law and order and work culture and UP couldn’t?

Let us now look at the demand factor. The authors say that a more demanding populace makes government’s policies and scheme more effective. A critical part of public becoming demanding is that even the poorest, who are usually from the deprived castes, become aware of their rights and fight for them. This sounds right to me but it again begs the question why was population in UP unable to do this.

As I mentioned, the last three CMs of UP have completed their full terms. Two of them, Ms. Maywati and Mr. Yadav, are not from upper castes. Ms. Maywati was born in a dalit family and Mr. Yadav’s caste is included in Other Backward Castes. They completed their full terms. Yet, they were not able to change the demand factor from the weaker castes in the state? Similarly, the current CM Yogi Adityanath has talked a lot about improving the Law-and-Order situation in the state. But that has not reflected in the state NSDP per person yet. As can be seen below, TN NSDP per person keeps galloping ahead.

Source: RBI Handbook of Statistics on Indian states

Maybe businesses invest in state only after they see a long period of relatively peace. Maybe, it takes many years of demand from public for the state to become more efficient. Maybe all of this will come together soon. The state will become peaceful and more equitable. The fertility is also dropping in the state and soon it will also be beneficiary of the demographic dividend. Maybe all of this will happen together and soon. Hopefully.

Update: From the comments that I have received here on the blog and on social media, two themes emerge.

1. Is presence of a seaport important? Generally speaking, coastal states in India have done better economically than hinterland states although there are exceptions. Being close to a port may be very important for manufacturing, especially low-cost manufacturing that employs a lot of people. As a comment on the blog points out, this is believed to be a crucial factor for economic development of nations.

2. Law and Order: Almost everyone believes that the law-and-order situation in UP and North in general is way worse than it is in Southern states and that discourages business investment. As I mentioned in my post, this seems right to me. It is difficult however to measure law and order objectively as most measures can be and are gamed. The book I referred to has three measures for evaluating this factor. Police firing per million population, proportion of civil to total police (consisting of both civil and armed police) and pending cases in court. On all three measures TN has done much better than UP. While, I share the belief in importance of law and order and the perception that UP has been much worse on it than most off the country, I am not very happy with the measures but I do not have good alternatives.

Relatedly, many commentators have claimed that the situation has improved under Yogi Adityanath. As I have pointed out, the NSDP / capita of UP has seen no consequent improvement. Supporters of the current CM argue that the law and order needs to be better for a long period of time before businesses become confident about making investments. I am sympathetic to this argument. However, I hope that everyone agrees that ifBJP comes back to power and if by the end of their second term, the NSDP / capita has not started catching up with the South then BJP also would have failed UP economically.

[1] The book talks of economic divergence between Northern and Southern states and TN and UP are used as foundational case studies.

[2] The authors are fairly humble in their discussion of the factors that may be contributing to the economic divergence. I commend them for their tone.

Author –

Yogesh Upadhyaya

(Yogesh Upadhyaya is one of the founders of AskHow India. Blogs are personal views.)

You can follow AskHow India (@AskHowIndia) or me (@YogeshUpadh) on twitter or me on LinkedIn or Medium. DM me if you wish me to put you on WhatsApp distribution list.

0

How can tax departments be less taxing for Businesses? (REODB 4)featured

January 08, 2022

Authors: Shankar Subramanian and Yogesh Upadhyaya

Around ten years ago, the CFO of an international semiconductor giant shared a startling statistic in an internal meeting. His company was fighting a total of 22 tax cases in the US in various stages of appeal. By contrast, the same company in India had over 25 tax cases in litigation in various fora. The sales in India were 5% of the US sales and the company had been in India for around 15 years whereas it had been in the US for over 40 years since its inception. This anecdote underscores an important aspect of tax administration in India — excessive and prolonged litigation with no sight of closure. Even while India has rationalised its tax rates and simplified the processes, the unpredictability of rule changes and prolonged litigation are dampeners for any business. These are often not captured in the statistics used in Ease of Doing Business. In this post, we will cover how and why businesses get hassled by tax authorities and what can be done about it. Let us begin with litigation.

Image credit: Pixabay

The issue of prolonged tax litigations is multi-factor. The problem starts with the way the government computes its revenue. Unlike most businesses, which follow accrual based accounting, governments follow a cash method accounting. This means that whatever amounts the government receives in a year is counted as a revenue and whatever it spends is counted as an expenditure. So, if a business pays a part of a disputed tax demand, it is accounted as revenue in the year it is paid. If in the subsequent year the tax payer gets a favourable verdict in a court, it is accounted as a refund/ expense in that year. A respectable business running on accrual accounting would not account for such disputed part payments as income especially when they are in litigation.

The cash method of accounting for government finances is not unique to India. Most countries use this method. However, in India the problem is compounded by the unrealistically high targets set for tax collections. The unreasonable tax targets lead to many of the high, and at times unreasonable, demands. The businessman is forced to make a part payment. When he goes for an appeal, he often wins at higher level and the government is forced to refund in a subsequent financial year. This Kafkaesque process is supported by how the government evaluates the performance of its employees in tax department.

One of the authors (Shankar) was the finance manager in a soft drinks bottling plant in Maharashtra a few years ago. During the course of an audit by the Central Excise department, one of the inspectors pointed out that the unit was not paying excise duty on the glass scrap generated. The team replied that three different case laws in two high courts and one tribunal in other states had held that glass scrap generated in bottling plant was not subject to excise duty. The inspector’s retort? Courts in Maharashtra might take a different view! Later, when pressed for the real reason behind his stance, the officer admitted off the record that the company’s view was correct and advised us to pay under protest and file an appeal. His reason for being adamant was career progression. He did not want his superior or auditors to be under the impression that he was soft on any tax payer. He felt it would be a career limiting move. The amount was not high and the company’s appeal was upheld at the next level. But this was a complete waste of time for both the company and the tax department. This is a great example of government revenue accounting and consequent incentives for employees of the tax department.

These kinds of incentives lead to a plethora of litigation, many times for really small amounts. Economic Survey 2018, pointed out that as of March 2017, there were approximately 1,37,176 direct tax cases under consideration at the level of the Income Tax Appellate Tribunal (ITAT), high courts and Supreme Court. Just 0.2% of these cases constituted nearly 56% of the total demand value. On the flip side 66% of pending cases, each less than Rs. 10 lakhs in claim amount, added up to a mere 1.8% of the total locked-up value of pending cases.

The tax department personnel are evaluated mainly on their tax collection efforts. The targets are set at the beginning of the financial year and are a function of the expected nominal GDP growth that the government expects in the financial year. If there is any economic slowdown (which no tax department can ever control/ predict), the targets become too steep and that leads to high pitched demands. Often the tax departments cajole the tax payers to pay excess tax in the month of March to meet their targets. This then gets refunded in Apr/ May and creates a steeper asking rate in the next year. One way to alter this is to set targets differently and not include any disputed payments towards meeting of targets. Another way could be to give more emphasis on adding new taxpayers and expanding the tax base.

The incentives for officers in India are so strong that they appeal even decisions made by their own officer. In all tax disputes, we have four levels of appeal. The first appeal is within the department itself , followed by an Appellate Tribunal, the High Court and then the Supreme Court . The first level of appeal is usually heard by an officer designated as Commissioner (Appeals). Most often, he sides with the tax department for career progression reasons. In the rare cases that he upholds the view of the taxpayer, the department often goes in appeal against his decision. Inevitably such cases fail at the next appellate level too but it prolongs the agony of the tax payer and results in a waste of judicial time. The Economic survey of 2017–18 gave some numbers on the Direct Tax side. It said that the tax department is responsible for filing over 80% of the appeals. Also the tax department loses nearly three fourths of the cases at appellate stages ( 73% in Supreme Court, 88% in High Court and 74% in Tribunal). Why would this be allowed ? That brings us to the third issue — Oversight and Audits .

Tax officers in the country are scared of the three Cs. Central Vigilance Commission (CVC), Central Bureau of Investigation (CBI) and Controller and Auditor General of India (CAG). Officers feel that they cannot take any action that would be perceived as being pro-business because any of the three Cs may remark adversely on it.

The reader must note here that the authors are not making the case that the tax department is always wrong. It is believed that there is considerable tax evasion in the country. At times the wrong doers can engage in outright fraud in order to dupe the government. For example, businessmen were known to create fraudulent gate passes to claim that their supplier had already paid Excise Duty on their input material. A few such instances became the reason for Excise Department officers finding minor faults and rejecting gate passes even for legitimate entries. Thankfully, this kind of fraud is much more difficult with the introduction of Goods and Services Tax (GST). The GST paid is recorded in a centralised system and it is very easy to verify any credit claimed for tax paid on any input. This reduces both, tax evasion and reasons for the tax department to harass innocent businesses. This success of GST gives us a clue to what would be most effective measures.

Systemic changes that reduce the possibility of tax evasion are perhaps the best way of reducing harassment by tax officers. However, such changes are necessary but not sufficient. There have to be incentives both at government and at individual officer level to ensure less harassment and litigation.

So what can be done to make life of business people easier? What measures would result in Real Ease of Doing Business? Given below is a non-comprehensive list.

1. Exclude any tax / penalty paid under protest by tax payer from the achieved targets of the department. In most disputed cases the tax payer who disputes has to pay at least 50% of the demand when he goes in appeal. This amount is taken as revenue for the year and refunded in the year when the tax payer wins the appeal (along with interest).

2. Maintain a record of each employee that shows how many appeals initiated by the employee were lost by the department. Make this record a significant part of the employee’s performance evaluation.

3. Measure department targets not just on revenue collected but also in bringing in new taxpayers into system

4. Have stricter norms for appeal including independent legal opinion on the merit of the taxman’s stand.

5. Regularly publish number of cases being litigated by tax departments at different levels.

There are many other suggestions made by different bodies including the Economic Survey of 2018. These are not easy for outsiders to monitor however. Ministers can make announcements. It would take an enlightened and empowered bureaucracy backed by a visionary minister to implement such suggestions and find out what works. This is hard slog. Something not easily captured in newspaper headlines or Ease of Doing Business Rankings.

You can follow Shankar Subramanian at www.linkedin.com/in/shankarsubram

Author –

Yogesh Upadhyaya

(Yogesh Upadhyaya is one of the founders of AskHow India. Blogs are personal views.)

You can follow AskHow India (@AskHowIndia) or me (@YogeshUpadh) on twitter or me on LinkedIn or Medium. DM me if you wish me to put you on WhatsApp distribution list.

0

Hiding in plain sight — How did South Korea (and others) develop so fast?featured

December 18, 2021

As a young man in 1990s, I looked up to Japan, South Korea and Taiwan. These were the Asian ‘miracle economies.’ Countries that became developed in the twentieth century while starting from scratch. In 1960s, the per capita Gross Domestic Product (GDP) of India and South Korea was similar. Today the per capita GDP of South Korea is 15 times that of India. Taiwan has a similar story. Why did these countries develop so fast? Joe Studwell answers this question in the book How Asia Works. According to Studwell, all three “North East” Asian countries and China followed the same development template. Other countries like Philippines, Malaysia, Thailand and Indonesia — the South East Asian group — followed a different development strategy and hence remained poor or got stuck at a middle-income level. Studwell’s analysis is intriguing and I want to discuss it in detail. In this post, I will first layout Studwell’s hypothesis and then briefly apply it to India.

Representational Image of Seoul by Ethan Brooke from Pixabay

The core argument

The core argument of Studwell is as follows.

Countries at different stages of development require very different economic thinking. At a minimum, there are two kinds of economics.

· Economics of development: This is applicable in early stages of development when a country needs to learn how to be more productive. Countries need a lot of assistance in this stage. This is similar to how a young person attending school or college needs help.

· Economics of efficiency: Applicable to a country at a later stage of development.

There are three critical steps in the economics of development

I. Land and agricultural policy: The key first step is land redistribution. In addition to land redistribution, the country should support the small landholder farmers with credit, marketing assistance, technology transfers and with inputs such as seeds, fertilizers, etc.

II. Manufacturing with export discipline: Manufacturing is critical to increasing the productivity of an unskilled population. It is also the primary source of better paid employment. However, in initial stages, the manufacturing in a country needs support before it can compete with countries that are already developed. This support can be in form of subsidies and credit and in form of tariff and non-tariff barriers to imports. Such support however, could lead to the local manufacturing becoming inefficient. So, the governments should ensure that there is competition and the losers in such competition are weeded out. The government should also ensure that the manufacturing companies are obliged to export and compete in the world markets.

III. Control of financial sector: Banks and other financial institutions should lend as per the development priority of the country. This means lending to small farmers and also to companies which may not initially have too much experience of manufacturing. Banks usually resist such pressure and may have more profitable and perhaps safer lending options such as retail and real estate lending. The government would need to force the banks to lend as per the development priorities of the state.

Let us look at each of these in detail.

Land and agriculture policy

In early parts of development, most of the population in a country is engaged in agriculture. Market forces, if left to themselves, lead to stagnation or even fall in agricultural yield. This is because the demand for land is much greater than supply and this imbalance leads to a very high land lease rate. The land lessee (or the share cropper) has very little incentive or spare money to invest in the land. The lessor (or the land lord) also has no incentive for investing in the land preferring instead, to maximize his revenues by increasing the rent. The first critical step of a good agriculture policy is land redistribution.

When land is redistributed, a family of five or six people may get to own a small area — say around a Hectare. The family would do every little thing that needs to be done to increase yield. For example, they could start with planting seeds in trays indoors and transplant the small shoots later to the ground. Or they would apply fruit and vegetable compost plant by plant. Or they could target watering, with taller plants getting more water. The list of such tasks is endless and Studwell calls this large-scale gardening. These tasks are back breaking and the marginal return to labor would be very low. The return on cash invested might also be low. The yield per unit of land however, would be very high. For a society with very few employment options, this is the unit of efficiency that matters.

The land reforms need to be supported by measures such as easy availability of fertilizers, good quality seeds, knowledge creation and dissemination and marketing support. When done well, these measures and the consequent yield increase has many benefits for the society.

· At the most fundamental level, the increase in income of small farmers is a good thing by itself.

· This increase in incomes leads to an increase in demand for manufactured goods. This demand, at least in the beginning, is not very sophisticated and that is great for the nascent manufacturing industry in these countries.

· The increased yield also means that the country would not need to use its precious foreign exchange for food imports.

· The income surplus, parked in banks, could be used by the country to lend to manufacturing companies.

· Finally, there is a psychological impact of these changes. The small farmers, who increase their prosperity through hard work, become more confident. In countries where land reforms were executed well, many capable political leaders and businessmen come from an agricultural background.

Across Asia, land was very unevenly distributed in the early part of twentieth century. For example, in 1928 in undivided Korea, 4 per cent of households owned 55 percent of agricultural land. In Taiwan only a little over 30% land was farmed by owner cultivators and rents reached 70% of output for some high-quality land. In Java in 1960, 60% of rural population was landless with the average holding of those fortunate enough to have land being under half a Hectare. In passing, I must note that there seems to be something structural about agriculture that leads to such land holding patterns. I would love to explore this triumph of Pareto in a future post.

Countries in the North East Asia group — Japan, Taiwan and South Korea and later China — had a meaningful land redistribution followed by effective support to small farmers that lead to a sharp increase in crop yields. Countries in South East Asia group — Philippines, Indonesia, Malaysia and Thailand — did a halfhearted land redistribution. In the South East Asian group, the land redistribution was mainly on paper and rich and influential landowners never relinquished control of their land. If somehow, they were forced to let go of parts of their land, they immediately re-leased it from the new landowners at very low rates either because the small landowner did not have money to grow crops or because he was intimidated by his former landowner or both. Of all the countries in South East Asia group, Studwell has the harshest words for Philippines.

Studwell takes the example of Eduardo ‘Danding’ Cojuanco or ‘Boss Danding’ of Philippines. Even after the supposed land redistribution, Boss Danding owned more than 6,000 hectares. Boss Danding was Ferdinand Marcos’s crony and under him was the governor of Development bank of the Philippines and ran a coconut marketing monopoly. He lived in Negros Occidental and controlled most of local mayors and congressmen. His power allowed him a lifestyle of living in a mansion — called the White House — and indulging in his passion for vintage luxury cars, big motorbikes and fighting cocks. When the law forced him to redistribute his land, he formed a joint venture with his tenants but retained management control. The workers were paid wages and 35% of profits but Danding’s costs in the joint venture are not open to audit. This story repeats itself across South East Asia. The rich and politically connected can subvert land reforms unless they are done exceedingly well. And when they are implemented well, the difference is obvious.

In the North East Asian countries, the yields went up significantly. As per the book

“In the first ten to fifteen years following the shift to small scale household agriculture in successive east Asian states, gross output of foodstuffs increased by somewhere between half (in Japan, which was the most productive country) and three-quarters (Taiwan).”

Incidentally, this worked even for cash crops. For example,

“… the sugar yield on small household farms in Taiwan or China has traditionally been 50 percent more than on pre- or post-colonial plantations in the Philippines or Indonesia.”

This increase in yields improved income for a large part of population and helped jump start manufacturing. However, there is an expiry date for the benefit of these policies and as a country starts becoming rich, it needs to start tapering the support given to farmers. As can be expected, it is easier to institute policies that help farmers, then to remove them. Japan for example, has not been able to do it. However, the benefits of good land policies in the initial years of development far outweigh the costs to government finances and to consumers in the later years.

Once land redistribution and other agricultural policies have helped jumpstart manufacturing, they have achieved their biggest development role. Let us look at manufacturing policies next.

Manufacturing / Industrial policy

Manufacturing is very important for the development of a country. Most of the workforce in an underdeveloped country is not very skilled and machines used in manufacturing can scale their capabilities. Such scaling is not easy in services and therefore manufacturing is crucial for the development of any large country [1].

Studwell argues that at the beginning of the development process, a country has very limited capacity in manufacturing. He says that such a country needs support from the government in the shape of subsidies and protection. He further says that every developed country has seen such protection in its history [1].

Britain had such protections when it started industrializing. For example, only British flagged ships were allowed in British and British Colonial ports. Britain also taxed export of raw wool and the import of wool clothing in order to promote its wool textile industry. Then there is the example of East India Company. The support this company got from the British government would take multiple books to list out.

Another prominent example of protection of nascent industry is United States. Alexander Hamilton, the Treasury Secretary responsible for the early manufacturing policy of United States coined the expression ‘Infant Industry’. And an infant — whether a human or an industry — needs protection. The US government provided a lot of it.

Why does a country at the beginning of its industrialization need protection? It is because manufacturing techniques cannot be learnt by reading theory. Learning by doing is the only way for a country to acquire this capability and the companies engaged in such learning are bound to make mistakes. If they are not protected from experienced competitors, they would be wiped out.

Of course, such protection can lead to the companies becoming inefficient. Studwell says that two measures would keep such tendencies in check. The first measure is competition and ruthlessness in culling out the losers. The second is export obligation. Studwell believes that this is where the North East Asian countries executed well and the South East Asian economies did badly.

He takes an in-depth look at South Korea. General Park Chung Hee took over the country in a coup in 1961. He decided that businessmen would work according to development priorities set by him. He literally jailed many of them and the community got the message that they had to get into manufacturing and succeed. Businessmen were forced to enter into technical tie-ups and get into fertilizers, synthetic fibers, cement, iron and steel, etc. without any previous experience of manufacturing those products. At that time, Hyundai was one of the five big construction companies in the country. The founder of Hyundai, Chung Ju Yung, had never manufactured or exported anything. Chung started with manufacturing cement and quickly started exporting it. Then, he also started making and exporting cement plants. In 1968, he had the permission to import and assemble Complete Knock Down (CKD) car kits in a joint venture with Ford. The state policy forced car assemblers to quickly increase the local content. Soon access to bank finance was progressively conditioned on building a truly Korean car and exporting it.

The Korean car market in 1973 was only 30,000 cars but still three manufacturers were licensed. In spite of the controlled prices, the market was too small for any company to make profits. Hyundai Motor Company (HMC) made losses every year from 1972 to 1978. The earliest market leader was the Shinjin Chaebol which took too much debt and the government forced it out of business. As the market grew, other entrepreneurs wanted to manufacture cars and the government licensed them but made sure to ruthlessly weed out the losers. After a few decades of competition and the financial crisis, HMC was the clear winner by 2000.

HMC entered the US market with a small car — Excel. It managed to sell 260,000 units in 1987 and 1988 on the back of aggressive pricing and advertising. The company made huge losses on these exports. The company cut costs and volumes fell but by mid 1990s the volumes stabilized and HMC started making profits in the US. By 2010, HMC along with Kia which it had purchased, was tied with Ford as the fourth biggest global auto group.

In contrast, the South East Asian countries did a very poor job of persuading big entrepreneurs to get into manufacturing. The biggest businessman in Malaysia, Lim Goh Tong who began in construction, got government concessions in oil and gas and has since become very wealthy due to monopoly in gambling. In Indonesia and Thailand, the biggest businessmen are not into manufacturing. Studwell has the harshest words for Philippines again. According to him, landowning families dominate the business scene in the country. They do the minimum assembly work required and are protected by high tariff walls. None of these countries has a manufacturing brand to match a Hyundai or a Toyota or even an Acer.

I think that what kind of business makes money for a country’s largest businessmen is a very important Indicator. If the largest businesses men are in commodities and / or government granted monopolies, then it is a bad sign. These large businesses would squeeze the margins of downstream manufacturers. Low margin for manufacturing would mean that those businesses do not have money to invest in technological development and increasing productivity. If the productivity in a country is low, then by definition its GDP per capita cannot be too high. The largest businessmen usually have the most political power. They can use this power to make sure that their commodity and / or concession businesses are protected. This imposes a large cost on the economy.

Both, small farmers and nascent manufacturing companies, need support from banking in initial stages. This may not be very easy in a financial system that is totally free to do what it wants. Let us look at this next.

Keep banks on a short leash

The author argues that an appropriate land and manufacturing policy can succeed only if financial institutions lend as per development policy. A bank may reasonably prefer to lend to a large plantation rather than to many small farmers. However, that would cause land reforms to fail. So, banks may need to be coerced to lend to small farmers practicing large-scale gardening. Similarly, it takes time for a society to learn manufacturing. And companies need funding support during this time. Again, a bank may reasonably prefer to lend to real estate companies or to make individual or retail loans. Governments in North East Asia forced banks not to make such decisions.

Bank depositors paid the costs of such policies. A generation of savers in South Korea for example, put their savings in banks and got a meagre interest rate. In a sense these savers financed the development of the country.

Conglomerates used profits from one business to fund another. For example, Hyundai’s ship building business became profitable much before its automobile business. Profits from the former were poured into the latter. There were many such examples. Minority shareholders, if any, of the profitable businesses were hurt by such moves. In the intense development phase of South Korea, retail investors in both debt and equity got a raw deal. Then there is the question of macroeconomic policies.

Studwell argues that there was almost no correlation between what are considered prudent macroeconomic policies and success in becoming a developed economy. In South Korea, rediscounting of export loans was unlimited. There was also unlimited rediscounting to other government favored projects. One of the consequences of these policies was an inflation rate of between 15 and 20%. Additionally, General Park Chung Hee nationalized all the banks. Taiwan was much more conservative comparatively. The interest and savings rate were comparatively higher and the inflation lower. Taiwan also did not face the balance of payment and banking crisis that South Korea did. However, both of them succeeded in transforming their economies. In the not so successful South East Asian group, you have the opposite extremes of Thailand and Philippines.

Thailand has followed most of the prudential financial policies prescribed by IMF and World Bank and yet it remains a middle income country. There are no internationally competitive Thai firms. Philippines on the other hand has been the most fiscally profligate. It is economically in worse shape than Thailand and all other South East Asian countries. However, all countries in this group — whether conservative or not — are much worse off than the North East Asian cohort.

The difference between the North East Asian group and the South Asian group is not their macroeconomic policies but how well they implemented their agriculture and manufacturing polices. The not so successful countries followed the prescription of World Bank type economists and the successful economies relied on economic history. In fact, this debate between economists and economic historians is a running theme through the book.

Economist versus Historian

As I mentioned in the beginning, Studwell says that there are at least two economics. One for the developing countries and another for developed countries. He calls the latter efficiency economics — a broad umbrella term for a wide range of thought that generally believes the government interference is wrong in all circumstances. Studwell criticizes the efficiency economist of not understanding history. He believes that everycountry in the world protected its manufacturing in the early stages. Countries have no other choice. When manufacturing skills are low, competition from sophisticated global companies would destroy the ‘infant’ industry. Just like how an experienced professional boxer would destroy a child or a teenager, no matter how talented. Studwell believes that efficiency economists do not understand this because they have very little understanding of economics history.

Studwell claims the Germany followed the prescription of Fredrich List and the so-called Historian school when it was developing. Japan learnt from Germany and South Korea learnt from Japan. List believed that the free-market evangelism emanating from Britain was opportunistically based on that country’s technological leadership. Here is List

‘Any nation which by means of protective duties and restrictions on navigation has raised her manufacturing power and her navigation to such a degree of development that no other nation can sustain free competition with her can do nothing wiser than to throw away these ladder of her greatness and, to preach to other nations the benefits of free trade, and to declare in penitent tones that she has hitherto wandered in the paths or error, and has now for the first time succeeded in discovering the truth.’

Studwell has an interesting anecdote on the relative influence of List in South Korea and in the United States.

‘The Korea and Taiwan scholar Robert Wade observed when he was teaching in Korea in the late 1970s that ‘whole shelves’ of List’s books could be found in the university bookshops of Seoul. When he moved to the Massachusetts Institute of Technology, Wade found that a solitary copy of List’s main work had been last taken out of the library in 1966.’

The efficiency economists can be very influential as they dominate academia and such institutions as World Bank and International Monetary Fund (IMF). Studwell’s recommendation is that a developing country have a clear plan based on teaching of Fredrich List and counter the influential efficiency economist by lying. According to him, the Chinese government has taken a lot of project specific technical support and financing from World Bank but has never entertained its prescriptions for prematurely deregulating its economy. IMF was prevented from seconding officers in its ministries as it has done in other countries. As he says

‘The standard Chinese response to IMF efforts to get inside the bureaucracy over the years has been: ‘Do us a seminar.’

As I read the book, I kept wondering about how India and China fare on the prescriptions of Studwell. The book has a chapter on China and is worth reading even though much has changed in the country since the publication of the book (2014). India is mentioned off hand a few times — mainly as a country that has failed in its development. I have tried to put some summary thoughts on where India is on Studwell’s framework in the next section. Unlike this article till now, the next two sections are not from the book.

What about India?

How does India compare on the three-pronged development recommendation of Studwell? A deep dive is beyond the scope of this already long essay but here are my quick observations. Let us start with land reforms.

Land reform in India is complex as it is a state subject. As I discussed earlier, making rules is not enough. The rules have to be implemented well on ground otherwise the landlords can undo all the land redistribution. Hence, land reforms have to be evaluated state by state and from what I can make out from a little bit of research, the three states that did a good job of land redistribution in India are West Bengal, Kerala and Jammu and Kashmir. This probably led to a better life for the small farmers in those states but certainly did not help in developing manufacturing. None of the three states is known for its industrial dynamism.

India has a history of helping farmers through other measures such as credit, cheap fertilizers and procurement support. However, the implementation of all these policies has been criticized. For example, as I have analyzed here, the benefit of procurement under Minimum Support Price (MSP) goes to very few farmers.

Even with these shortcomings, India may be now anyway getting at least some of the benefits of a good land and agriculture policy. Recall, the benefits to the society we discussed earlier. One was increase in rural demand for manufactured goods. In India of today, a lot of support from the Union budget goes to rural areas as I have explained here. This support — especially MNREGA — has raised the minimum wages and has increased the rural demand. Another benefit of a good land policy is reduced need for precious foreign exchange for food imports. Food sufficiency plus exports, led by software services, have made the exchange situation in the fairly comfortable.

There is no doubting that we still lag in manufacturing which results in lack of meaningful employment for large sections of the population. This also makes India a low productivity country. This lack of manufacturing capabilities is a result of our policies for the first many decades since independence.

A lot of what needed to be done to promote manufacturing is under the central government and while the government did set up companies for manufacturing of chemicals, fertilizers, heavy machinery, etc. it is clear that there was a lacuna in our policy. First of all, due to industrial licensing and due to reserving of many sectors for Public Sector, there was very little competition for manufacturers, both in public and private sector. More importantly, in India there was no export obligation and companies had very little pressure too improve. Most crucially, there was no penalty for failure. The country has got a working bankruptcy system only in the last few years. For the first few decades, companies were monopolies or oligopolies in their field which could sell their substandard products to customers at a very high rate because the customer had no choice. The companies had no pressure to improve technologically. And if a company failed even in this easy task, its existence was never threatened. Precious capital was locked in such bloated and inefficient producers. Indian companies took advantage of protection and credit and delivered almost nothing in return. We have started seeing some changes in the manufacturing policy in the last few decades but clearly a lot more can be done.

One surprising revelation of the book is that the ownership of the banks did not matter. General Park nationalized all banks in South Korea. That did not prevent it from becoming a manufacturing powerhouse and a developed country in a very short time. I have

always felt that the bank nationalization in India in 1969 was a very bad move. Now, I am not so sure. The bad part of the move was the banks were directed to lend to companies that had no incentives to improve. Like Korea, deposit holders in India too subsidized companies. However, unlike in Korea, we got very few world class manufacturers in return.

India has not managed to come up with any globally known manufacturing companies such as Hyundai, Samsung or Huawei.

Summary and general discussion

Redistribute land and support your farmers. Encourage your entrepreneurs to get into manufacturing and support them while making sure that they do not become inefficient. Make sure that your banks support these policies. Is development really this easy?

The first thing to note is that a simple articulation of a process does not make it easy. Each of the above sentences has many implementation challenges on ground and tackling them is nowhere near easy. Redistribution of land is incredibly tough. Rich landlords are politically very powerful. They have all kinds of ways to subvert any land redistribution process. Similarly, big businessmen are economically and politically powerful. They resist being put under conditions like export targets when they can make much more money from trading in commodities or state sanctioned monopolies or from real estate projects. Their political power means that they can price their commodities high making it difficult for manufacturers to prosper.

Also there is the question of what is true in social science. In general, I believe in empirical evidence rather than in a theory even if the theory is mathematically elegant. However, empirical evidence is not easy to interpret. If a country did follow Studwell’s prescriptions, is it guaranteed to succeed? Or would it be that if the country fails, we would say that it did not do a good job in implementation? Reminds me of discussions on cricket. Why did Virat Kohli succeed? Because he was assertive. Why did Hardik Pandya fail? Because he was reckless. My assertiveness is assertiveness and yours is recklessness. Or as Hindi films and a Big Boss participant have respectively said,

Tumhara khoon khoon, humara khoon pani?

Sada kutta kutta, tuada kutta Tommy?

Such questions are way above my paygrade. But it makes sense to me that efficiency economics is great for a society to reach the local maxima. However, if it wishes to search for a global maxima, it needs help in changing its trajectory. We see this in groups of people all the time. We also see it in countries which are stuck in low income or middle-income traps. There is of course the risk that any policy attempt to change trajectory can be captured by vested interests as it was done with manufacturing in India in the past.

To end this already very long post, I will very briefly describe some things that India could do. Do remember that we are in way above my pay grade territory.

· Land redistribution is very unlikely in most parts of India right now. However, some of the benefits of land redistribution are already occurring due to budgetary transfers to rural areas and other developments.

· Rural India is very diverse. An apple orchard owner in Shimla is very different from a tribal farmer in Palghar. The latter needs the support that the former is probably getting. It is crucial that we retarget support to farmers that need it although this is very tough politically.

· India has no choice but to increase its manufacturing. Manufacturing should be thought of at least at two levels. Low-tech labor-intensive manufacturing that creates a lot of employment and relatively technology intensive manufacturing. Both are needed but may require different policy prescriptions. Low tech manufacturing needs little protection. It does need all help possible in terms of Real Ease of Doing Business. Competition between states would be a good tool for both keeping manufacturers honest and for increasing Real Ease of Doing Business.

· This may be the perfect time for India to make a sustained effort to get its manufacturing right. Changed global geopolitical scenario creates a window of opportunity for us. As does the fact that manufacturing itself will change significantly in coming years due to impact of Artificial Intelligence, Robotics and Internet of things. Software is critical component of these technologies and India has some strength in software.

· What does ‘sustained effort to get manufacturing right’ mean? A lot of things. Focusing on Real Ease of Doing Business as have been talking about in our series on this topic. Getting bankruptcy right and making sure that it stays right. Ensuring that there is money for firms that want to get into manufacturing, especially technologically intensive manufacturing. This even when most of the ‘risk capital’ goes into relatively easier areas such as food delivery.

This list of what needs to be done is incomplete and more importantly, as we know, implementation is very different from announcements. So how would we know if the country is actually making progress? One indicator would be if more of our richest and most influential businessmen are into manufacturing and less in commodities or concession-based businesses or in food delivery. Another indicator would be when India based consumer good manufacturing companies become household names in the developed markets in the world.

I look forward to that day.

[1] With the exception of port financial havens such as Hong Kong and Singapore and super specialized agricultural exporters such as Denmark and New Zealand.

I have forgotten who recommended the book, How Asia Works, to me. My heartfelt thanks to them — I enjoyed it and learnt a lot.

Author –

Yogesh Upadhyaya

(Yogesh Upadhyaya is one of the founders of AskHow India. Blogs are personal views.)

You can follow AskHow India (@AskHowIndia) or me (@Uppi89) on twitter or me on LinkedIn or Medium. DM me if you wish me to put you on WhatsApp distribution list.

0

Why does the myth of low government salaries persist?featured

November 13, 2021

Edit: I have added a small section ‘Why does it matter?’ towards the end based on a few comments I recieved.

Don’t think badly of me but I am the kind of person who gets into discussions on social media! Many of these discussions are on the performance of governments in India. There are people who argue that the bad performance is due to the ‘low salary’ paid by government — a version of the ‘pay peanuts, get monkeys’ argument. I am not very surprised by this as a few years ago, I too believed that government employees get a low salary. In this post I will try to explain why this belief persists in some people.

But first, aren’t salaries in government low?

Are government salaries low?

In 2015, the Indian Institute of Management, Ahmedabad (IIMA) compared salaries across government and private sector. Here are some of the highlights from their detailed report.

1. The salary in government was higher or similar to the salary in private sector for 35 of the 37 categories that IIMA looked at.

2. In many of these 35 categories the government salaries were much higher. So much so that a professional with 15 to 25 years of experience in a private company would get a lower salary than the starting salary in government! Examples of such professions included physiotherapists, lab technicians, teachers, draftsmen and gardeners.

3. In many professions, private sector jobs were in two kinds of organizations. The salaries in the first type were comparable to government salaries but were much lower in the second type. School education is a good example of this phenomenon. Some private schools are prestigious and may well pay salaries comparable to the salaries in government sector. However, most private schools pay their teachers and staff much lesser money than what the government pays.

4. In a few jobs the salaries in the private sector were much lower to start with, but caught up in a decade or so. These were jobs where skills were required and either there was a lot of demand for experienced professionals or the supply was restricted. A good example would be nursing. The starting salaries for nurses in government sector was more than thirty-seven thousand whereas in private sector it was between thirteen and seventeen thousand. For professionals with 25 years of experience the salary went up to ninety thousand for both.

5. The starting salaries in some private jobs were really low. Especially, when compared to starting salaries in any government job. For example, the starting salary for scientists in the private sector was between thirteen and eighteen thousand. Whereas, the starting salary for drivers in government jobs — where the qualification requirement was only matriculation — was around twenty-five thousand!

6. The only two categories where the private sector salaries were higher were Doctors with MD / MS and in accounting services. It must be noted here that for doctors with MBBS, the salaries in private sector were lower. Even in accounting services, only some companies paid some professionals a high salary. The salaries for other accounting professionals were much lower.

As far as I could make out, the qualification requirement for private sector jobs was the same as comparable government job and in some cases, it was even higher!

The IIMA report looked at “fixed pay, variable pay, allowances and benefits, and employers’ contribution” while making comparisons. Non-cash benefits were not included. One of the biggest benefits of a government job — job security — is an example of non-cash benefit. Covid-19 demonstrated the value of this benefit. Many private companies fired their employees or reduced their salaries when the pandemic hit their revenues. This was not a risk you had to face if you were a government employee.

Another non cash benefit of a government job is status. This is a point made even by the Seventh Pay Commission.

“It may be observed at the outset that government service is not merely a contract service, it provides a status in society which cannot be monetised in terms of money value (sic).”

The IIMA study compared mainly category B and C jobs in government sector with similar jobs in private sector. As per the Seventh Pay Commission report, Class B and C employees are more than 97% of government total strength.

As I have shown, in most cases government jobs paid much more than private sector jobs. However, comparing government and private sector jobs is only half the story as most Indians do not even have a regular salary paying job.

Employment does not mean regular salaried work.

In India, only 48% of people with any kind of employment, had regular salaried jobs in the quarter October — December 2019 [1]. This is when the Labor force Participation rate in the same quarter was as low as 37% (57% for male and 17% for female). In other words, more than 60% of working age people were not looking for employment and of those employed, only 48% had regular salaried employment.

We have extensively covered the difference between Naukri (job) and kaam (work) in our piece on employment. The 52% not in regular salaried employment were either employed in their own enterprises or were casual laborers. It is known that most of these enterprises are very small businesses such as vegetable carts and these businesses do not make much money. Most of the people who work as casual laborers or in own enterprises would switch to a regular government job or even a private job if they could get it.

To summarize, most government jobs pay much more than private jobs. Furthermore, these come with job security and a high status. Additionally, a regular wage paying job is not the norm for working age people in India. Casual labor or work in own enterprise pays much lesser than even a private job. Then why do some people still believe that government salaries are low? I could think of three reasons why it may be so. The first reason is that they may be thinking of state government jobs when they think of government jobs.

Do state government jobs have a low pay?

The comparisons that I have made above are for central government jobs. It is beyond the scope of this post to compare salaries of all state government employees with salaries in private sector, but I note two things.

First, many state governments link their salary levels to that in central government. Here is Seventh Pay commission again

“It is clear from the study that a significant number of States follow the recommendations of the Central Pay Commission. Equally, there is significant plurality of States that design their own pay awards based on the recommendations of their own State Pay Commissions, which of course do consider the recommendations the Central Pay Commission and subsequent Government of India award.”

It is my belief that relatively poorer states are the ones which do not base their pay on Central Pay Commission. Hence, the salary levels even in private sector there would be lower than in richer states. The government finances of such states also may not be robust enough to have a pay scale similar to that in central government.

The second thing to note is that many news reports make it clear that most citizens prefer government jobs to any other employment. This desire for government jobs is reflected in the applications that governments get in response to advertisements. For example, this story states that the UP government received applications from 3,700 PHDs holders, 50,000 graduates and 28,000 PGs for 62 posts of messengers in UP police. The post had a minimum eligibility of Class V.

Based on the two factors mentioned, I believe that it is likely that most state government jobs in the country pay higher salary than most private jobs.

Let us look at the second possible reason for the persistence of myth of low salaries: the association of bad performance with low salary.

Does bad service performance by state government lead to the myth of low salaries?

It is possible that people reflexively associate bad service delivery with low pay. So, if they see pictures of shabby government schools or hear about bad educational outcomes, they automatically assume that the employees in those schools must be paid badly.

A related belief that I encounter goes something like this. Yes, government salaries are more than private sector salaries but given the importance of certain jobs, the salaries should be even more. For example, policemen and women should be paid highly so that they have no reason to become corrupt. Or that senior IAS officers make crucial decisions that impact large parts of the country and they should be compensated accordingly.

I have some sympathy for the view. I have seen administrative officers tackle extraordinarily complex challenges, many times working in very adverse conditions. However, I should note here that it is very difficult to discriminate performance amongst government employees and governments cannot pay every employee a much higher salary. There simply isn’t enough money. The wage and pension bill of central and state governments is already very high and many of them get a lot of their work done from contract employees to save on their employee costs! Many states for example, employ school teachers on contract.

I think that the possibly lower state government salary and association of bad service delivery with low pay are not the main reason for the persistence of myth of low government salaries. The main reason is the Pareto Principle and the availability heuristic.

The Pareto Principle and the availability heuristic

I have performed professionally as an Improv theatre artist in Mumbai for the last ten years. One of the privileges of this job is working with highly talented actors. One of the sorrows has been to see how much these talented actors have to struggle financially. This is true for most actors. Mumbai is flooded with talented people from across the world trying to catch a break and most of these people make very little money. And yet, in the general perception, actors are rich people. This is because people associate acting with superstars like Ranveer Singh and Priyanka Chopra. But for every Ranveer Singh there are hundreds of extremely able actors, who have to do all kinds of odd jobs to make ends meet. A very small proportion of actors enjoy a very large share of the revenue that all actors make. This small proportion is very visible because media talks about them all the time. This visibility makes us believe that the very highly paid actors are representative of the whole acting community. This is the Pareto Principle and availability heuristic in action. I believe that these shape our perception of the private sector jobs too.

We hear of the very high remuneration levels of CXOs in large companies or even the starting salaries for great programmers in Googles and Amazons and believe that it is representative of salaries in private sector in general. We compare these salaries with salaries in government sector and believe that they are low. This comparison becomes particularly stark when we consider the highest salaries in government and in private sector. The salary of the Cabinet Secretary of India would be beaten by that of hundreds if not thousands in the private sector. This could also be true for many other administrative services employees (IAS, IPS, IRS and IFS) of the government.

My father was a professor in a university and his pay scale was linked to government salaries. We never discussed salaries at home but I had vague impression that his salary was low. This is possibly because in my mind, I compared it with what a few business people made and with what I read about pay of corporate employee. The vast majority of the country that made much lesser money never entered my consciousness! However, once I became aware of the low-income levels in the country, there was no way to unsee it.

Why does this matter?

If some people think that government pay is low and they are wrong, how does it matter? Especially, as the majority of Indians, who think that a government job is the best option for themselves, do not think so.

It matters because the people who think that government pay is low are well educated folk who earn a lot. Their voices carry more weight than the voice of others. Also, a lot of international and national analysis on performance of governments starts with low pay as a cause. Such thinking is detrimental to figuring out the real reasons for suboptimal service delivery. A more effective government is critical for the development of the country and we should know what causes bad service delivery and what doesn’t. I hope to write more about this in future.

Summary

1. Salaries for most central government jobs are higher than comparable jobs in private sector.

2. It is very likely that salaries for state government jobs are higher than private sector jobs too.

3. Some people believe that salaries in government jobs are low probably because they associate bad performance with low salary. It is also possible that they believe that people performing crucial roles in society deserve more.

4. However, the most likely reason for the persistence of the myth of low government salaries is the Pareto distribution of jobs in private sector and the Availability heuristic. A very small share of private sector jobs pays extremely highly and such jobs get disproportionate attention, making some of us believe that those jobs are representative of all private sector jobs.

[1] I have used the pre-pandemic quarter to avoid any short-term distortions. Although the scale of the figures I am citing is not very different post pandemic also.

Thanks to Manjari for helping me understand this issue more and to Sandeep for pointing me towards IIMA report. As always, errors are all mine.

Author –

Yogesh Upadhyaya

(Yogesh Upadhyaya is one of the founders of AskHow India. Blogs are personal views.)

You can follow AskHow India (@AskHowIndia) or me (@YogeshUpadh) on twitter or me on LinkedIn or Medium. DM me if you wish me to put you on WhatsApp distribution list.

0

How do I manage my subordinates?featured

November 02, 2021

Edit: The framework I have detailed below is the Skill-Will Matrix. As per the Internet, It was first derived in 1970s Paul Hersey and Ken Blanchard! My thanks to reader Kamonasish Aayush Mazumdar for identifying it.

In my first year as an entrepreneur, I was managing ten people. Soon, this number crossed fifty. This was a new challenge for me as in previous work as an analyst, only one person reported to me. My lack of skills in being a boss made it a very frustrating experience. I would assign a task to a colleague and discover on the due date that they had done something totally different from what I had asked them to do. Or that they had completed only a tenth of the work. I blamed this on my subordinates till it became obvious that the problem was at my end. At that time someone shared a simple framework for managing people with me. I found this framework immensely useful. Over the years, I have shared it with many entrepreneurs. Especially those who do not have too much experience of dealing with subordinates. In this post, I want to share this framework with you.

Let’s begin by imagining that you are setting your subordinate a task. The task could be as simple as writing a short program or much more complex one, say delivering a large project. Start by mentally rating your subordinate on their skill level for the task and on their sense of responsibility. That is, place them in one of the four quadrants in the chart below.

Note that these two attributes may not be highly correlated. I have had colleagues who were very responsible but did not understand their job very well (Quadrant B). I would assign them a task and discover a few days later that they had not understood what needed to be done. I have also worked with brilliant people who were not very responsible (Quadrant C). These people would understand what needed to be done but would underestimate the time they needed to do the task. Or their work would have many obvious ‘silly’ errors. You can get lucky and get people in D, but that is rare. It is more likely that your employee is in A. So how do you deal with this situation?

The heuristic is as follows

· For someone not very skilled with their job, you need to give very detailed instructions. Define the task as much as you can and make sure that your subordinate understands your instruction. It is possible that your employee says that they have understood what needs to be done when they have not. I found it useful to ask them to tell me what they understood. Sometimes we would have to do this multiple times.

· For someone not very responsible, you need to regularly monitor what they are doing. Break the task down into intermediate milestones and check their work regularly against those milestones. This monitoring needs to be at least a little formal. I have worked with brilliant people who would reply yes, if I just asked them if everything was on track. However, if I actually sat down with them to understand what they had accomplished, I would realize that they had barely begun. Many times, they were not lying, but simply assuming that their brilliance would somehow make things happen on time.

This is it. This simple trick, applied with discipline, reduced my frustrations with my employees significantly. It also reduced their frustrations with me!

Note that there can be situations when you yourself are not in D, especially in a startup. For example, imagine you are an entrepreneur with no experience in graphic design and you have asked someone to develop your pitch deck. In such a situation, it would not help to give them detailed instructions on fonts and designs but it would be crucial if you can nail down what you wish to communicate. If your designer is a D or a C, they would make sure that they extract this information from you. Your job would be to make sure that you set enough time and patience aside for this.

This framework is also useful for helping develop your colleagues. You need to help them move from A or B or C to D. That is, you need to help them upgrade their skills or their sense of responsibility. When they are a D and you are a D magic happens!

There are many more things to managing people and even more to being a leader. This simple framework however, can help you significantly.

The person who communicated this framework to me got it from their boss. Maybe their boss got it from someone else or maybe they got it from a book or journal. If anyone knows the originator of this framework, do comment. I would love to credit them. In the meanwhile, I just want to pay it forward and hope that it benefits someone who is frustrated in dealing with their subordinates.

Author –

Yogesh Upadhyaya

(Yogesh Upadhyaya is one of the founders of AskHow India. Blogs are personal views.)

You can follow AskHow India (@AskHowIndia) or me (@YogeshUpadh) on twitter or me on LinkedIn or Medium. DM me if you wish me to put you on WhatsApp distribution list.

0

Involve community in cleaning Mumbai’s seafeatured

October 16, 2021

I have always been fascinated by the sea. As a kid when I visited Mumbai, I would sit for hours at a window and stare at the Arabian sea. I eagerly looked forward to getting into the water. I remember going to Dadar Chaupati and entering the water in the 80s. You could just about do it then but is impossible now given how filthy the water is. The stink from Mithi in Bandra, when you drive past it, will kill any desire to touch the sea water. There is hope that this would change. Mumbai has tendered six state of the art Sewage Treatment Plants (STP) in the city. However, given the experience of STPs across the country, Mumbai would be well advised to do a better job in monitoring these STPs when they become operational and also involve the local community in this effort. Otherwise, we may spend a lot of money but may get very limited results. To understand this, let us start with why the water in the sea around Mumbai is filthy.

Image by ELG21 from Pixabay on for asiprational purposes

Water gets dirty from two types of human activities. First, industries let out their effluents into small rivers and streams which empty into the sea. Secondly, the discharge from toilets and kitchens in households and commercial establishments leads to mainly organic waste entering the water. Let us take a quick look at industrial discharge.

Industries are supposed to treat their effluents before discharging them but many don’t. They take advantage of the fact that state pollution control boards, the agencies in charge of enforcing pollution laws, are understaffed and sometimes corrupt. The challenge of getting thousands of small and big factories, some formal and others informal, to obey the law is a big one. It will take time for us to tackle this challenge. However, that need not make us despondent. Industrial waste may not be the biggest contributor to organic pollution.

Household organic waste might be a much bigger contributor to water pollution than industries. This report from Central Pollution Control Board states that industries contribute less than 5% of the Biochemical Oxygen Demand (BOD) load of Yamuna in Delhi. BOD is a measure of organic pollution. I would bet that household and commercial discharge is the biggest cause of organic pollution even for Mumbai. Now, the wastewater from households is supposed to be treated by a STP before it is discharged, but this system has two challenges.

First, not all households are connected to Sewage lines. Waste water from unauthorized building and slums may flow to the nearest drains which may flow untreated to nallahs and rivers like Mithi. To connect these households to sewage lines is not an easy task. Sewage lines need to be built in often narrow roads with very little information on other utility lines which might be serving households. Such projects take time and are rarely popular with the residents.

The second challenge with the system is that STPs don’t work as per norms. The country is littered with plants that were built with a lot of fanfare but never delivered. The Mumbai tender is for the private bidder to build and operate the plant for a few years but what prevents the bidder to do a bad job of operating the plant? Maharashtra Pollution Control Board publishes a report on the performance of STPs across the state but the report is not timely. Additionally, the pollution numbers are for the whole year. A plant can have a good annual average performance while being awful on some days. If the performance of a plant is not being monitored regularly, there is a good chance that the operators become lax. This is doubly problematic in Mumbai as the opposition is already alleging that the cost of STPs in Mumbai — Rs. 15,000 Crores — is much higher than that in the rest of the country. What is the solution?

We must mandate that all STPs in Mumbai measure and publish their operating performance online. This is something that Bengaluru already does so it is technically possible to do it. Bengaluru does another interesting thing. It involves community members in keeping an eye on the discharge quality. These may be residents living near the lakes where the treated water is being discharged or farmers which use the treated water. We should do this in Mumbai too. People living in fishing villages in Worli and Mahim or vendors on Juhu beach or walkers on Bandstand are likely to notice when the water round them starts stinking. And they are likely to care much more than someone living far away. Creating a mechanism to take fast feedback from these communities would be a good way of making sure that the STP operators stay honest.

Imagine living in a city where there is no stench when you drive past a river. Where you see fishing folk jump from their boats into the water. Where you can whip out your phone and reassure yourself that all the STPs are working well. A city where you can decide to just take a towel and take a dip in the sea on any of its beaches. Mumbai can be that city.

My thanks to Priyali, Vishwanath and Indra for helping me understand the complexity of this subject. Errors are all mine.

Author –

Yogesh Upadhyaya

(Yogesh Upadhyaya is one of the founders of AskHow India. Blogs are personal views.)

You can follow AskHow India (@AskHowIndia) or me (@YogeshUpadh) on twitter or me on LinkedIn or Medium. DM me if you wish me to put you on WhatsApp distribution list.

0

Ease of Doing Business Rankings — Searching under the lamppost (REODB3)featured

September 21, 2021

“In principle, we should measure what we value, yet the reality is often the opposite — we value what we can measure.” From China’s gilded age by Yuen Yuen Ang

When I was running my own software business, I found the coverage of my industry in newspapers remarkably shallow. The reported concerns were rarely the concerns of me or my cofounders. A couple of years ago, I wondered if this was true for other industries and for business in general. So, I met nearly fifty business leaders across the country. Over these fifty meetings, many of which stretched up to two hours, I realized how the worries of these leaders were rarely addressed in Ease of Doing Business discussions in media. Especially, the discussions driven by Ease of Doing Business Ratings. In this post, I will show that not only Ease of Business Ratings do not address the concerns of business leaders, but also that no amount of tweaking of the methodology can change this reality. There is a fundamental flaw at the heart of all such ratings.

I have analyzed the World Bank’s Doing Business ratings in detail. My initial criticism is specific to this methodology. However, the fatal flaw that I point out further down, will be valid for all such ratings.

Let us begin with the fact that the WB DB ranking is not meant for business leaders and investors.

Doing Business is not for Business Leaders

I have never seen any business person refer to the Ease of Business ranking while making an investment decision. This, not only in media reports but also in my fifty interviews. Turns out that the Doing Business Ranking is not supposed to be an input in investment decision making. The foreword of 2020 Doing Business from the President of the World Bank group says this explicitly

‘It’s important to note that Doing Business isn’t meant to be an investment guide, but rather a measurement of ease of doing business.’

Doing Business is an analysis of the regulations that impact business.

‘The Doing Business indicators are based mostly on laws and regulations: approximately two-thirds of the data embedded in the Doing Business indicators are based on a reading of the law.’

When I understood that Doing Business was meant to guide policy makers, I assumed that it would focus on concerns of business leaders. Turns out that I assumed wrong. Doing Business is so focused on regulations that it does not even talk to business leaders! As the 2020 report says

‘Because of the focus on legal and regulatory arrangements, most of the respondents are legal professionals such as lawyers, judges, or notaries.’

DB does talk to business professionals such as accountants, architects, engineers, freight forwarders, etc. but these conversations are only related to factors such as paying taxes, dealing with construction permits, trading across borders, and getting electricity. I agree that these are relevant factors. But they are by no means crucial factors for most businesses, as I will discuss further.

Before that, let us look another significant criticism. Even for a large country like India, the WB index focuses on just two cities.

Doing Business is unrepresentative

As has been widely commented upon, the DB scores are calculated at only two places in India. In Mumbai and Delhi. These cities are very different from rest of India. Take registering property for example, which is a component of the rating. Can you imagine the procedures in Mumbai being anywhere representative of procedures in rural Bihar or for that matter in a village anywhere? The internet is filled with stories of people trying to change the status of agriculture land, a challenge not likely to be faced in Mumbai. And yet, rating of India is based just on Mumbai and Delhi. But that is not the only reason DB is unrepresentative.

As is well known, India has lagged in manufacturing. Our share of employment from manufacturing is really low. Now, it is very difficult for new manufacturing capacity to come up in these mega cities. So not only is Doing Business rating unrepresentative because Mumbai is very different from a village in Bihar. But also, Doing Business does not meet the urgent needs of India. The ratings are being computed for cities which neither can get nor aspire for new manufacturing facilities.

In face of this criticism, Doing Business points out that they have subnational rankings which should be looked at. However, the national rankings that compare India — with a population of more than 1.3 billion with Latvia (population 1.9 Lakh) or Azerbaijan (population 1 Crore) get a lot more traction in the press as far as I can see. So, this defense is bit disingenuous. I understand that Doing Business will be including more cities in India soon. However, this will not really solve the problem because of issues that I discuss further down.

In any case, there are other serious issues with Doing Business. Mainly, their ignoring of very important factors and them having too many factors.

Missing important factors

There are eleven factors and forty-one sub factors used in calculating the Doing Business score. In my meeting with business leaders, most of these factors never came up. The biggest concern in the minds of these leaders was demand. Most of them felt that if they had more demand for their products or services, their businesses would grow. Now the demand for a product is related to the price. For example, demand for high quality flats in Mumbai is huge but not at current prices which are higher than those in most other cities in the world. Many businesses cannot reduce prices for their products because of high costs. One such cost that came up in many of my interviews was delay in payments. If your customers do not pay you in time, you have to borrow money to meet your expenses. The cost of this borrowing can severely dent your profits and many times even kill your business.

And yet, delay in payments is not a part of Doing Business criteria. The 2020 report states that they would be including Government procurement as one of the criteria in future but as far as I can make out, the government delaying payments is not something they would measure.

Ajay Chibber, writing in Business Standard, used the illuminating phrase ‘Ease vs. cost of doing business in India.’ Most times, cost of doing business is order of magnitude times more important for businesses than the narrowly defined ease of doing business components.

You could say that factors like delayed payments have nothing to do with ease of doing business and that the cost and ease are different things. You would be right as far as the dictionary definition of the two words is concerned. However, the question is what are we trying to do here? Are we trying to make sure that more businesses flourish so that the society can prosper? Or are we trying to make sure that it is easy to do business even if most of them die because of the high costs? As the aim is obviously to make sure that most businesses flourish, we have to focus on factors which are important and urgent for most businesses and not on those which may be peripheral for all but a few. I expect to write posts on factors such as payment delays, in future.

Take another issue, the Goods and Services Tax (GST). One of the 11 factors in Doing Business is trading across borders. What is measured is the ‘Time and cost to export the product of comparative advantage and to import auto parts.’ This factor would be important for a small country where most of the business involves importing and / or exporting — say a country like Singapore. But for many businesses in India, selling to different states within the same country may be much more important than selling outside the country. For these businesses the Goods and Services Tax (GST) brought about a significant change. Now, we can have our own opinions about the GST and how it was implemented. What is important for us to note is that the GST wouldn’t change country’s Doing Business Rating at all. Either up or down.

All this is not surprising. Doing Business is focused on regulations and procedures so costs are not considered. Plus, one of the chief concerns for the methodology is comparability across nations. This means that factors which are not important in every country are not considered even if they are critical in a country.

If Doing Business, or any other Ease of Doing Business ranking system, were to measure at many locations and if it were to expand its criteria, would it become more useful? No. There is a fatal flaw at the heart of any rating like Doing Business. Let us look at that.

Fatal Flaw

Access to electricity is one of the factors in Doing Business rating. It is composed of four sub factors namely, procedures, time, and cost to get connected to the electrical grid; the reliability of the electricity supply and the transparency of tariffs. Note first that the cost of electricity is not something that is included. For a business that has significant energy intensity, say Aluminum smelting, the cost of electricity may be the make-or-break factor. For this business it would not matter if the supply is reliable if it is very costly. For some other business, say software development, reliability may matter much more than cost. For a new factory, the biggest worry may be getting an electricity connection quickly. What is the point here? That for different businesses, what is critical or even important may be different. Even for a business, what is important changes over time.

However, when we average scores over different factors, the importance of a single factor in the overall rating reduces. In trying to represent all challenges faced by all businesses, an average of many factors will end up representing no one.

In the movie Incredibles, there is a dialogue between the characters Dash and his mother which illustrates this point,

‘Helen (Mrs. Incredible) says, “Everyone is special, Dash”.

Dash retorts back to her, “Which is another way of saying that no one is.” ‘

Substitute important for special and they might as well have been talking about one of the Ease of Doing Business ratings.

Thus, we have an unresolvable dilemma. If you have fewer factors, then what is crucial for many businesses may not be included. If you include everything that is important for everyone, the weightage of individual factors is too low to matter. This is a mathematically irresolvable problem.

There are many other conceptual flaws that I can point out in EODB ratings, but it is time to discuss the implications of these flaws.

Discussion

Let me summarize what I have said till now

· The Doing Business ratings are not meant to guide investment decisions. They focus on regulations in a country. This is illustrated best by the fact that Doing Business does not take any inputs from business leaders.

· The Doing Business ratings are not representative for India because they are measured only for two cities. This is ridiculous for a continent sized country. Furthermore, they are computed for Delhi and Mumbai where no new manufacturing facilities are expected to come up when India desperately needs to increase manufacturing.

· Many factors that are critical for businesses are not included at all. Some like promptness in payments are not included probably because Doing Business focuses on regulations as written and not what actually makes doing business easier or harder. Others like GST may not be included because there may not be equivalents in smaller countries.

· It is not possible to fix these two problems by measuring in many locations and by including more factors. This is because what is critical or even important for a business at a point of time depends on what kind of business it is and where it is located. If we increase the list of factors, then each individual factor becomes less important in the rating. This makes the rating irrelevant for more and more businesses. That is, the rating is irrelevant for some businesses because either a factor crucial to them is not included OR because it is weighted too low. These are opposing forces and I do not see how any rating can resolve them.

So how can we identify critical factors for all businesses and address those? We can’t. At least not centrally. The problem is twofold. Different business in different locations have different problems. And these problems change rapidly with time. Any attempt at mimicking these with a contrived ratings is doomed for failure.

These are the problems that managers in those individual firms solve. Or these are problems that managers in government organizations should be solving. In his famous essay, The Use of Knowledge in Society, the economist Fredrich Hayek says that the economic problem of society is mainly one of rapid adaptation to changes in the particular circumstances of time and place. He further states that any attempts to centralize this decision making is doomed to failure. Ease of Doing Businesses ratings are attempts at such centralizations.

If EODB ratings are poor tools, what can governments do? What can we as citizens do if we wish to evaluate government performance? The second question is easier to answer. We as citizens should be looking at increase (or decrease) in business rather than at proxies for business. Is business in a jurisdiction increasing? Is the employment increasing? If the answers to these questions are satisfactory, then why do we care what a rating says?

The task of a government is trickier. There are many interface points between the government and businesses. Someone wishing to work on making these interface points more friction free cannot use aggregate current business metrics. I suggest however, that simple ratings are no substitute. The governments would need to look at the situation case by case and develop specific metrices but more importantly empower functionaries at the lowest level possible. Let me illustrate this with an example.

Think of a state that has many industrial parks scattered over its large geography. The state has created these parks to increase business. The state should measure the increased business in a park — maybe from taxation figures — to judge the performance of the officer in charge of the park. The state should empower this official to help resolve any of the problems that a business in the park may face — whether it is irregular electric supply or a delay in registering property.

This is of course not a complete solution for a state. If the park has many garment factories and if their biggest problem is slow export procedure in the nearest port, then intervention may be needed at a different level of government for example. Or more generally, most businesses do not work out of industrial parks. The example is meant only to illustrate the broad principle. This is Real Ease of Doing Business (REODB) and I plan to develop the REODB theme over the next few months. Any inputs from readers are hugely appreciated.

You could ask me what is wrong if states, under pressure to improve their rankings, actually reduce their procedures to get an electricity connection or for registering property. My answer is that there is nothing wrong in cutting out unnecessary regulations. There is nothing wrong even with the states and central governments targeting an improvement in rankings just to get better media coverage. What is wrong is if the states, under media pressure, put their focus on these factors rather than the factors which are more important for their businesses. It would be as if an unfit person smokes two packets of cigarettes a day, does not eat well or exercise but expects to be commended because they drink a cup of green tea!

Measure what is valuable and empower people to do tasks that impact what you are measuring. That is tough. Order of magnitude tougher than using a rating. But there is no point in using a metric just because it is easier.

Thanks to Raunaq Onkar for pointing me towards the Ajay Chibber article.

This is the third article in a series on Real Ease of Doing Business (REODB). The first two articles can be found here

1. The local bullying of business .

2. How is China so welcoming of business.

Author –

Yogesh Upadhyaya

(Yogesh Upadhyaya is one of the founders of AskHow India. Blogs are personal views.)

You can follow AskHow India (@AskHowIndia) or me (@Uppi89) on twitter or me on LinkedIn or Medium. DM me if you wish me to put you on WhatsApp distribution list.

0

How did Haryana stop killing its unborn daughters?featured

April 11, 2021


Haryana seems to have reversed its practice of discriminating against its unborn daughters. The Sex Ratio at Birth (SRB) for the state has been more than 900 for the last six years. Contrast this with the state’s history. The Child Sex Ratio (CSR) in the state was 819 in 2001 Census and 834 in 2011 Census. [1]. This low ratio was due to sex selective abortion — the practice of determining the sex of fetus and aborting her in case of it being female. How did the state manage to turn things around? That is what this post it about. But first, a short background.

Image by Gerd Altmann from Pixabay

As I have discussed in another post — Missing women in India — low Sex Ratio at Birth (SRB) in a society happens due to three reasons. The first is a strong preference for male child. The second is a widespread availability of technology for determining the sex of a fetus and for a subsequent abortion. The third is low fertility — if couples decide to have fewer children, a strong preference for sons could translate into them going for Sex Selective Abortion. Haryana has a well-documented preference for the male child. It is a relatively prosperous state and many people can afford to pay for technologies for sex determination and subsequent abortion. The fertility in the state is relatively low. These reasons together had driven the SRB in the state below 850. (It is generally agreed that if there is no sex selective abortion, the SRB would be between 942 and 953).

The problem has been well recognized for decades. You can find reports of men in Haryana ‘importing’ brides from other states — a consequence of there being fewer women — from early 2000s. Incidentally, Haryana was not the only state with this challenge. Many states in North and West of India have had very low SRBs. One of the responses of India was the Pre-Natal Diagnostics Techniques (PNDT) Act of 1994. The act made it illegal for a medical professional to determine the sex of a fetus. However, the first conviction under the 1994 act happened only in 2006! The enactment of the law did not scare many people in Haryana and the situation was so bad that there were open advertisements of the type — spend 5,000 now to save 5,00,000 later. A barely concealed hint that a daughter now would mean a hefty dowry later.

Moreover, most complaints under the PNDT Act were for not complying with formalities like registration and not maintaining proper records. A medical professional determining the sex of the fetus would not put the result of his investigation on paper and would be safe as long as he complied with the formalities. To really stop Sex Selective Abortion, you had to catch the medical practitioner in the act.

To catch a practitioner in the act, you need a decoy. Obviously, the decoy needs to be a woman and needs to be pregnant. The Haryana government requested and encouraged pregnant policewomen and other pregnant government officers to work with them. These women would go with other undercover officers and secretly audio and video record their interaction with the doctor. If they were able to get proof of malpractice, they would arrest the offender and file a case against him.

In practice this was not easy to do across many districts with different people in charge of police. The state had to write a robust Standard Operating Procedure (SOP) for teams so that not only were the offenders caught in the act, but also, they could be prosecuted successfully. The central team also had to persuade — sometimes skeptical police officers and CMOs — that there was real political will to go through with these cases.

As the number of cases mounted, the state faced a different problem. Brokers offering these services started recommending practitioners based in neighboring states. Haryana is geographically small and it is not difficult to travel to neighboring Uttar Pradesh, Delhi, Punjab, Rajasthan and Uttarakhand. Regular readers of my blogs would of course know that law and order is a state subject and police from Haryana cannot directly work in other states. Partnerships had to be established with police and political leadership in all these states so that raids and prosecutions could be made in those states as well.

Haryana has registered 889 First Information Reports (FIR) till now [2]. Of these 249 were in neighboring states. The state has managed to get more than thirty convictions. Unfortunately, in India the convicted can get bail pending appeal and appeals can take a very long time. The state of Haryana not only prosecuted vigorously to convict but also fought hard to deny bail to the undertrials. The bail appeals reached Supreme Court in the case of Dr. Anant Ram and the Supreme Court upheld the decision to deny bail.

Of course, practitioners are resisting efforts of the state government. Well established doctors earn a lot and if prosecuted, they can mount a formidable legal and sometimes not so legal defense. There are many cases and counter cases against what the government alleges are ‘repeat offenders.’ But it does seem that the government action has had significant impact.

As I have discussed in my previous post, data from the birth registration system shows that these measures have led to a remarkable improvement in SRB at birth in the state. The SRB is higher than 900 for nearly all districts. Again, as I discussed in my previous post, the civil registration system has its weaknesses. For example, in earlier years the SRB was calculated on the basis of both the births in the year as well as previous year births which came up for delayed registration. When the SRB calculation was changed in 2013, it jumped by nearly 50! This clearly shows that not all births are registered immediately in state. So as outsiders, how can we judge whether the state has really made progress?

I talked to a few people in Haryana asked them for their perception whether there was an actual change on ground. Whether, doctors and brokers are more scared of the law then they used to be? The people I spoke to included an activist / scholar who has worked in this area for a long time. With one exception, the feedback was that the difference is real and this included the feedback from the scholar / activist who does not necessarily have a reason to like the Bhartiya Janata Party (BJP), the party in power. In any case, as Dr Rakesh Gupta, nodal officer for Beti Bachao Beti Padhao, is quoted in this report as saying, “…I am hopeful of Haryana’s CSR reaching 903 females against 1,000 males when 2021 census data is released. We may wipe off the blot of four decades”. We will know for sure soon.

Even if census confirms this welcome trend, the struggle is far from over. Technology can and does change things drastically. Law enforcement in Haryana is coming across mobile vans equipped with portable Ultra Sonography machines. Practitioners now work out of automobiles just outside Haryana border! The machines are imported from China — a country that is a leader both in Sex Selective Abortion and in manufacturing — making them very cheap. Another technological advance that the society would need to grapple with is In Vitro Fertilization. In this technology, sperm and eggs are fertilized together in a test tube and only selected embryos are implanted in the mother’s womb. The selection can easily be for a male offspring. Fertility clinics have started offering services in which male offspring is assured although this is illegal. These challenges however, are for the future. In the meanwhile, we can learn from the state’s success.

Low SRB arises from deeply rooted preference for the male child. The problem of Sex Selective Abortion is acute in many countries in Asia and as far as I can make out, only South Korea has been able to tackle this challenge. I would have assumed that the only way to change the situation is to change mindsets. Laws would not make much of an impact because it is very tough to implement such laws. I have would have been on the side of the people who would have talked of the proverbial behavioral ‘nudge’. The Haryana example shows that I would be wrong.

A consistent, committed and strict Law implementation can be sometimes the best way to tackle serious ills in a society. In Haryana, the proverbial danda trumped the ‘nudge.’ Haryana may have set an example for the rest of the country and maybe many other countries in the world.

Author –

Yogesh Upadhyaya

(Yogesh Upadhyaya is one of the founders of AskHow India. Blogs are personal views.)

You can follow AskHow India (@AskHowIndia) or me (@Uppi89) on twitter or me on LinkedIn

_______________________

[1] The Sex Ratio at Birth is for the births of a particular year whereas Child Sex Ratio is for all children at the time of Census. SRB over a few years and differential mortality of the girl and boy child contributes to CRB.

[2] The number of FIRs is for both those under PNDT act as well as Medical Termination of Pregnancy Act

In general, my writing is positive (describing what is) rather than normative (what should be). However, in my three posts on low Sex Ratios in India, there is an underlying normative (what should be) assumption that low Sex Ratios are bad for the society. Similarly, there is an assumption that Sex Selective Abortion is bad.

This is the thirteenth and the last in a series on population. The first twelve articles can be found here

1. Everything you wanted to know about population (but were too lazy to Google).

2. Are the Acche Din of population growth already here?

3. Chhath — the new national festival?

4. Economic migration in India — The Who, the Why and other good stuff.

5. Islam and population growth in India.

6. Migration and political demography in Assam.

7. Missing women in India.

8. Is Haryana becoming Kerala?

9. Matters of Life and Death in India

10. Is everyone really equal in a democracy?

11. Does India still live in villages?

12. Is India overcrowded?

0

The local bullying of businesses (REODB 1)featured

March 20, 2021

Haryana wants to reserve 75% of jobs in private sector for the residents of the state. Andhra Pradesh came up with a similar law a little while ago. These are deeply ironic developments. Local politcians and governments bully local businesses and this makes it difficult for the businesses to put up factories and other places of employment. Local politicians also make it very difficult for many businesses to employ locals. Now the same politicians are coming up with laws to force the businesses to employ state residents. An apt metaphor would be if someone were to kick a human being and when they cried out in pain, put a tape on their mouths because they were making too much noise! This is what I want to talk about in this post — Bullying of businesses by local authorities.

Image by rebbeccadevitt0 from Pixabay

Around a year back, I travelled to many cities in India and talked to leaders of businesses of all sizes and in different sectors. The conversations started with my question, ‘What stops you from growing faster?’ Many themes bubbled up across these long unstructured conversations and one of the prominent ones was their reluctance to employ local people.

With a few exceptions, factory managers across the country told me that they preferred not to employ locals. An auto component business owner in Chennai ‘preferred to employ people living more than 25 km away from the factory.’ This was because he was afraid that the local employees would take the support of local leaders and ‘create trouble’. The phenomenon was not limited to factories. Once, I got talking to a waiter in a five-star hotel in Jhansi. It turned out that he was from Uttarakhand. I imagined that most other employees of the hotel would be residents of Jhansi but it was not so. The hotel owner preferred to employ outsiders because local employees were likely to ‘create trouble’ for him. Locals would ‘create trouble’ was almost an accepted wisdom in many of my interviews. All the interviewees knew of cases where the trouble had gone out of hand and the impacted business had to shut down.

Employees are not the only people bullying businesses. Local politician-businessmen intimidate successful businesses to give them a ‘cut’. An ex-manager of a Fast-Moving Consumer Good (FMCG) Multi National Company (MNC) spoke about his experience of setting up a factory in a hill state. The company, with the aid of its formidable management, its lawyers and its connections executed as per its plans. However, one of the hurdles it could not overcome was harassment from local politician-businessmen. The company was told very clearly that only ‘local’ trucks would reach the gate of their factory. The raw material and the finished goods of the company had to be transported by locally owned businesses. This led to a strange and inefficient situation that the ‘local partner’ would pick up deliveries from the factory gate and take them to the state border and the company’s national partner would then take over from there. A pharmaceutical entrepreneur had a similar story in a different hill state.

Factory owners are not the only victims of such bullying. The founder of a consulting company was setting up office in the Mumbai Metropolitan Region. Even before the office was inaugurated, representatives of the local politician paid them a visit and advised them that it was in their interests to give them the contract for catering as well as for the filtered water bottles. Or take the case of a construction contractor in Mumbai. His work in a Mumbai suburb evaporated overnight when the newly elected MLA of that suburb informed all builders that he would be providing the labor for construction in that area. In a third instance, a large grocery chain manager described in detail scenes of intimidation that sounded straight out of a Bollywood gangster movie! This intimidation continued till they shifted their workers to contracting companies owned by politicians.

Some of my interviewees talked about how when they tried to use their political connections at the national level, they were advised to sort the matter out themselves. Prominent national leaders across political parties were unable to intervene effectively.

I must point out here that many employers do not think that this kind of bullying is their biggest problem. Neither the FMCG nor the Pharma company leader thought that using local trucking companies was a very high cost to pay. The consulting company gave the distilled water supply contract to the local politician. All three were running high margin businesses and the cost impact of the measures was a small fraction of their selling price. The business leaders could shrug off this cost as the ‘cost of doing business in India.’ However, any business with margins lower than these does not find these costs trivial. Unfortunately, labor intensive industries such as garment and leather manufacturing, usually have much lower margins and are particularly vulnerable to such local tyranny. Smallest businesses like street vendors — again big employers — are particularly vulnerable. This is tragic as unemployment is possibly India’s biggest challenge.

The harassment by local power brokers gets really bad when you are setting up a new capacity or if you are looking to expand. Business owners across the country suggested that whenever they wanted to expand, getting the permissions from local authorities and politicians was the hardest. There was an excellent article on this topic by one Mr. Rohan Shah. The author detailed his experience of starting a new manufacturing business in Sangli in Maharashtra. The conversion of his own agricultural land to non-agricultural land could not be done even after more than a year of hard work. The Revenue Department first asked him to fill seven forms and then asked him to get 11 No Objection Certificates (NOC) from 11 different agencies. Each of these NOCs in turn required further NOCs and filling of even more forms. In his post, Mr. Shah is very clear that the NOC from Gram Panchayat — which was required for 4 out of the 11 NOCs — was extremely challenging.

In summary, local bullying of businesses can be one off three types. First, Local employees can intimidate businesses creating a strong incentive for them to not employ locals. Secondly, local business politicians demand a ‘cut’ from large businesses. Thirdly, whenever a manufacturing entity wants to set up a new factory or expand, getting permissions from local authorities is the most difficult. So, what can we do about this?

Answering this question — What can we do about the tyranny of local — is not easy. Making laws and procedures simpler is the most obvious part of the answer. A few rogue employees can use some of the more draconian laws to manipulate their employers. Reforming such laws while providing adequate protection to employees, while challenging, is a relatively simple task that the central and / or state governments can undertake. One of the NOC that was needed by Mr. Shah was from the Udyog Kendra — an office set up to facilitate investment in the district. I repeat this so that the irony can sink in — An office set up to facilitate investments was making the entrepreneur work harder to get clearances. Making procedural changes to remove such nonsense would be another obvious step. However, other instances of bullying are not so easy to tackle.

If local politician businessmen intimidate businesses to get a cut or if local bodies like gram panchayat refuse to give permissions arbitrarily, what can be done? This is not a matter of changing or simplifying rules as the bullies are not using those rules. They are in fact breaking laws while intimidating businesses. Why do elected officials discourage businesses in this way? Why does an MLA or a Sarpanch not encourage a business that would create more employment in their constituency? It is because job creation is not their priority.

I have discussed in detail why even an honest representative would rate job creation as low priority. In short, representatives have little power to make positive change and more importantly they believe that they get votes for visible action like agitating for a common good. A Gram Panchayat officer is more likely to get noticed for a road that benefits everyone rather than for helping set up a factory which employs just a few people. The incentives for permanent, non-elected government officers are even worse. There is no benefit for giving fast clearances and there could be penalties for not following process, however cumbersome and idiotic that process may be.

So how do we get elected and unelected officers in the government to respond positively to job creating businesses? I don’t have the answer to this question but may be the beginning of this answer can be found in another theme that bubbled up in my conversations with the business leaders. Other countries do it.

My interviewees spoke admiringly of many of our nearby countries. How Sri Lanka was very responsive to garment manufactures. How in Thailand, a port side manufacturing facility could be set up in less than 60 days. The most impressive stories come from China of course. Many of the business leaders I talked to, gushed about how local officials treat any businessman thinking of setting manufacturing in their district or provinces. The officers escort the business person to suitable sites, explain the rules and procedures and even wine and dine the business person in order to motivate them to invest. In short, they act like salespeople for their district and not gatekeepers.

My preliminary understanding is that this happens because districts and provinces in China are actually in competition with each other. Promotions of both government officers and Chinese Communist Party (CCP) leaders depend on the amount of investment (and hence jobs) they can attract in their provinces. How can we do something similar in our democracy?

That is the big question isn’t it? One thing though that we all can agree is that reserving jobs for locals is not the answer. It will only create new avenues for bullies to torment the already tormented businesses.

My conversations with business leaders about doing business in India were very different from what media reports as Ease of Doing Business. For example, as I have covered in this article, a factory owner looking to expand is most concerned by his interaction with local authorities. Business media however, is usually focused on actions of the central government. Agencies like World Bank that measure Ease of Doing Business also do poor job as they have to rely on published statistics and regulations as they are written, not the reality on ground.

This is the reason I have started this series on Real Ease of Doing Business. An attempt to draw broad patterns from actual lived experiences of business people. If you are a business leader, please do share your story. Here in the comments section or as a direct message to me on Twitter.

0

Arithmetic is the biggest enemy of farmers !featured

February 15, 2021

Indian society venerates farmers and rightly so. Food is the most basic human need and farmers provide it. Naturally, we feel a deep sense of unfairness when we think that an injustice has been done to farmers. However, this feeling may prevent us from seeing reality — There’s a limit to how much taxpayer money can go to the kisan. The limit is not because this profession does not deserve the money but because there isn’t enough money. The Arithmetic is cruel yet simple.

Image by Gerd Altmann from Pixabay

  • Pradhan Mantri Gram Sadak Yojna — For building rural roads: Rs. 15,000 Crores.
  • Jal Jivan Mission- for rural water supply: Rs. 50,011 Crores
  1. Virat Koli is right Greta ji is not.

Author –

Yogesh Upadhyaya

(Yogesh Upadhyaya is one of the founders of AskHow India. Blogs are personal views.)

You can follow AskHow India (@AskHowIndia) or me (@uppi89) on twitter or me on LinkedIn

0

Virat Kohli is right. Greta ji is notfeatured

February 09, 2021

The noted environmental activist Greta Thurnberg and some other celebrities recently expressed their support for farmers protesting against the government of India. It is impossible to doubt the honesty of their sentiment but I do wonder if they have understood the complexity of the issue completely. For example, it is not clear from their tweets whether they appreciate the impact of farming on the environment in the country. In this post, I draw a quick sketch of this impact.

Across India, rivers are extremely dirty. The holy river Yamuna when it passes through Delhi, is worse than a sewer. In our past writing we have identified the hard problem and the harder problem of cleaning rivers. The hard problem being how to stop pollutants entering the river and the harder problem being how to restore the flow of water in the river. Although Sewage Treatment Plants (STPs) are being set up at a higher pace than in the past to address the hard problem, we believe that we have a long road ahead in terms of getting them to work consistently. What is even more disheartening however, is that the harder problem — impact of use of water by agriculture — is understood so little. Agriculture, as it is today, is directly responsible for the state of rivers in the country. To address this lack of understanding, let us start with some basic facts about Yamuna.

The flow of water in Yamuna is very uneven across the year. As this report from Central Pollution Control Boards (CPCB) says, almost 80% of the water flow happens in the three monsoon months of July, August and September. The river has a very different character in the remaining months. Not only is the total flow less, but also almost all available water is taken up by agriculture.

The Yamuna originates in the Himalayas and snow melt in the mountains is one significant reason for a year long supply of water in the river. However, our thirsty agriculture uses up almost all the water in the non monsoon period. It is estimated that nearly all the water in the river is diverted at Hathnikund / Tajewala barrage and is used mainly for agriculture. The water flow in the river, till Chambal joins it, is mainly sewage from Delhi and other cities on its banks. The drying up of Yamuna is not just because of water being diverted for agriculture at Tajewala (and other downstream barrages) though. There is possibly another bigger reason.

Abhijeet Mukherejee and others studied the summer month water flow in the lower reaches of river Ganaga and concluded that groundwater extraction in the catchment area is the main culprit for the severe reduction in water flow in those months. They posit that the underground aquifers continuously feed the river and if the water table falls below the river level, then water flows out of the river as is explained in this image.

Furthermore, Abhijeet et al estimated that the snow melt contribution to the river Ganga in Himalayas was less than 10%! This means that the contribution from underground flows is very important. This analysis is for lower reaches of Ganga but it is very likely that a similar analysis applies to Yamuna too. So, not only is most of the surface flow stopped at Tajewala Bridge, contribution to flow from underground flows is likely to be reduced because of overuse of groundwater. Why does that happen?

Punjab and Haryana farmers have been growing paddy for a few decades. The water demand of this thirsty crop is met from canals and from pumping up groundwater. Studies show that Groundwater levels in Punjab have been declining continuously. For example, this study shows that groundwater level fell at the rate of 2 cm per year in Punjab between the years 2003 and 2014.

Paddy is not local to the region and a large part of the output is sold. The Minimum Support Price guaranteed by the government incentivizes the farming of this crop in an area that is not local to it. Why can’t the farmers switch to other crops? Because the markets for them are not well developed and farmers naturally prefer the price stability offered by MSP as we have explained here. The country spends a lot of money on MSP as well as on other schemes to support farmers. Tellingly, the protesting farmers are demanding a new law that guarantees MSP in some form even though the three laws they are protesting against, are not about MSP.

Falling groundwater and river levels are not the only environmental impact of agriculture. Pesticide and fertilizer overuse directly pollutes water resources. Stubble burning after monsoon — when farmers need to quickly switch from paddy to wheat — contributes significantly to the horrible air quality in those months across North India as we have explained in this post.

Of course, all this does not mean that the government is ‘right’ and the farmers are ‘wrong’. We have written a long post explaining why the government is doing what it is doing and why the farmers are doing what they are doing and our conclusion is that it is silly to think of this issue in terms of good versus evil. If we have to address the concerns of protesting farmers while tackling the challenge that farming poses to the environment and to badly needed revenues of the government, we need to come together to find a solution.

Celebrities guide our thinking on all sorts of issues even while being extremely busy with their speaking, singing, playing and acting careers. Furthermore, they have the remarkable ability to condense complex issues into 280 characters of a tweet. I don’t have this ability and hence I have gone with the tweet of our cricketer Viirat Kohl. I feel that his guidance may be more relevant on this issue than that of the environmentalist, Greta ji.

If you liked what you read, please do share. You may find my past writings on this subject interesting.

  1. Frequently asked questions on farmers protests
  2. Has the lockdown clean Yamuna? No!
  3. Air pollution and Climate Change are different issues.
  4. The hard problem and the harder problem of cleaning Ganga

As always, comments, criticism and praise are all welcome — preferably on the comments section of this blog!

Author –

Yogesh Upadhyaya

(Yogesh Upadhyaya is one of the founders of AskHow India. Blogs are personal views.)

You can follow AskHow India (@AskHowIndia) or me (@uppi89) on twitter or me on LinkedIn

0

Frequently Asked Questions on Farmer protestsfeatured

January 25, 2021

Delhi has seen protests from farmers for a few months now and the protests are likely to continue in the foreseeable future. Something else that seems set to continue for the foreseeable future is arguments on social media. These discussions are usually more strongly grounded in emotions than in facts. When the family WhatsApp group of one of the authors was consumed for a few hours by such a discussion, we decided that it is our duty to collect some of the relevant facts and put them in one place for the convenience of us argumentative Indians. We hope that after reading this piece, you will have more specific suggestions on How the Government should use your taxes to support Farmers. You may find that it is more difficult than selecting 11 players from 20 deserving ones, to use a cricketing analogy.

Image by Paul Brennan from Pixabay

This post is a set of questions and answers. The questions are what we see being asked on social media. The answers may be too detailed for some readers. Feel free to skip to summary at the end of the longer answers if you are pressed for time.

The government does. A lot of money is budgeted and spent by the central and state governments on farmers and on rural areas.

The Central Government has many schemes to support farmers. The biggest of them is PM — KISAN. In 2020–21, the budgetary provision for this scheme was Rs. 75,000 Crores. Under the scheme, all farmers in the country get Rs. 6,000 per year. The Ministry of Agriculture has many other schemes and the total provisions for all of them in 2020–21 was Rs. 1,42,762 Crores. In addition to PM-Kisan, this money was for subsidies on interest on loans and crop insurance amongst other things.

Additionally, fertilizers are subsidized in the country. The provision for this subsidy in the 2020–21 budget was Rs. 71, 309 Crores.

The Mahatma Gandhi National Rural Employment Guarantee scheme (MNREGA) is an employment guarantee for rural India. It is available to both farmers and non-farmers. Poorer farmers are likely to benefit from it. The provision for MNREGA in 2020–21 was Rs. 61,500 Crores. The Central Government also has other schemes for rural areas and the total budget outlay in 2018–19 (including for MNREGA) was Rs. 1,22,398 Crores. This included provisions for rural housing and rural roads in addition to the provisions for MNREGA.

Now the money for rural roads, housing and MNREGA does not go only to farmers as there are landless laborers and other non-farmers that live in rural areas. However, it is safe to assume that a large chunk of the money does benefit farmers. Take rural roads for example. Good rural roads mean better market access for the farmers as well as lower cost of transportation. As another example, farming families can take advantage of MNREGA especially if they are poor.

Of course, this is not all. Money from education and health budgets would go to rural areas (as it should). Additionally, State Governments spend a lot of money to help farmers. For example, electricity is subsidized for farmers and state governments compensate the electricity distribution companies for providing free or cheap electricity to farmers. Periodically governments across the country waive the outstanding amount of loans to farmers and have to compensate the institutions that have extended those loans.

It should be mentioned here that the governments may be spending money but not all money may reach the farmers. For example, many believe that the fertilizer subsidy helps the companies manufacturing them much more than it helps farmers. Or that the electricity distribution companies hide their corruption and inefficiency by exaggerating the losses they make on selling cheap electricity to farmers.

Summary: The Central Government spends a lot of money on helping farmers and rural India. The money is spent on direct financial transfer to farmers, subsidy for credit, crop insurance, and subsidy for fertilizers. Money is also spent on the employment guarantee scheme, MNREGA and on rural housing and rural roads. State Governments also help farmers financially. For example, by providing cheap or free electricity. Additionally, money from health and education budget would also flow to the rural areas. Does all the money reach farmers? No. Subsidies like the fertilizer subsidy are known to be inefficient. Electricity distribution companies are known to hide their commercial losses by blaming them on farmers.

In addition to the above, one of the big ways that the government supports farmers is by Minimum Support Prices (MSP). Let us take a look at it next.

How does the system of Minimum Support Price (MSP) work? The government announces a price for many crops. This announced price is higher than the market price. However, this price is effective in raising the price for farmers only if the government purchases the crops. The government does not have sufficient machinery — procurement and storage places, ability to grade and sort, etc. to buy grains other than wheat and rice. Hence, most of the procurement is in these two grains.

When the government purchases a grain at a high price, the price of the grain increases in the market. It can become unaffordable for many people. To support the poor, the government sells grains through the Fair Priced shops at a highly subsidized rate. The government needs to pay the difference between the purchase price and sale price through its budget. This is food subsidy.

The provision for food subsidy in the 2020–21 budget was Rs. 1,22, 235 Crores. How does the food subsidy work? The central government buys grains — primarily rice and wheat — and then sells it to states. The price at which this sale is made is called the Central Issue Price. The CIP has been fixed since 2002 and has been between Rs. 3 /kg and Rs. 6.95 / kg. The Economic Cost for wheat and rice has increased steadily and in February 2020 it was Rs. 27 / kg and Rs. 37 / kg.

Food Corporation of India (FCI) and state governments buy the grains on behalf of the central government. In the last few years, the government has ended up not giving the money that it has budgeted to FCI. However, if anything the budgeted amount is actually an understatement of food subsidy because FCI has been borrowing money to support buying of grains at high price and selling them at much lower price (or storing them). The dues from the government of India to FCI have increased from 41,517 crore at the end of 2015–16 to Rs 2.4 lakh crore at the end of 2019. This money will need to be paid by the government at some time.

Summary: An enormous amount of money is spent on food subsidy in India. This money is spent on buying grains at a high price and selling it at a low price. The high price is MSP. Mainly wheat and rice are bought under MSP.

Does the food subsidy go to farmers or consumers? Both do but it is not clear how much benefit either of them gets. The price at fair price shops is much lower than what it is in the market. However, the market price is higher than it would otherwise be because of MSP. Indeed that is the purpose of MSP.

Incidentally not many farmers get the benefit of procurement under the MSP. According to this article from Ashok Gulati

“What is the reality about MSP? The NSSO’s Situation Assessment Survey (70th round) revealed that in 2012–13, only 6 percent of farmers sold their produce at MSP.”

These farmers are mainly from Haryana and Punjab and Madhya Pradesh. This is perhaps the reason that the current agitation has drawn farmers from those two states. The fact that those two states are adjacent to Delhi might be the other contributory reason. The length and resolve shown in the agitation is a clear indicator that the subsidy is important to them.

Then there is the matter of leakages. According to this note from PRS

“Leakages may be of three types: (i) pilferage or damage during transportation of food grains, (ii) diversion to non-beneficiaries at fair price shops through issue of ghost cards, and (iii) exclusion of people entitled to food grains but who are not on the beneficiary list.”

And that,

“The latest available data is for 2011. According to the 2011 data, leakages in PDS were estimated to be 46.7%.”

The food subsidy is not efficient and a lot of money does not go to the beneficiaries.

The purchases under MSP have one more purpose — To keep buffer stocks in the country. India is the second largest country in the world in terms of population and any import of food into the country significantly raises the prices in the world market. It makes sense for the country to keep stocks of basic grains because in times of widespread shortages, the country may not be able to import grains cheaply, if at all. However, as this article states, the stocks of wheat and rice in the country are way over the buffer stocks. More importantly, the annual procurement of wheat and rice is more than 50% more than the distribution under PDS.

Can the excess grain produced in India be exported? For wheat, the international prices have been much lower than the MSP in the past and also lower than market prices. Recent spurt in international wheat prices means that purchases made below MSP may be exported. India does export some rice but this may be like exporting scarce water. This is because a lot of rice grown in North India takes up scarce groundwater. This is on the back of free or very cheap electricity provided to farmers and is one of the main reasons that our rivers are depleted and filthy.

One other impact of the MSP system has been the lack of diversity in the diets of Indians, especially the poor. Because rice and wheat are available very cheaply, other grains like Millets are disappearing from their diets. This has negative health consequences. We believe that now that the country has significantly tackled the challenge of providing basic nutrition to everyone, it can no longer ignore the nutrition challenge.

Summary: It is clear that the food subsidy system is inefficient and corrupt. It is not easy to determine how much of the subsidy goes to the farmers and how much goes to consumers. Only 6% of farmers benefit from procurement under MSP. Over the last few years, much more grain has been procured than has been distributed through PDS. This means that the stocks of wheat and rice in the country are very high. Wheat cannot be exported because the price of wheat in Indian is generally much higher than international prices. India does export rice but that is like exporting water because a lot of rice production in the country takes up scarce water.

How much does the Central Government spend on farmers and why cannot it increase?

If we add the money budgeted for the Ministry of Agriculture, fertilizer subsidy, rural development and the food subsidy, the total is Rs. 4,33,677. That is 14% of total budgeted expenses of the central government of Rs. 30,42,230 Crores.

More than 20% of the total expenses is interest payment — which is the largest budgeted expense. The second largest expense is the government establishment. A lot of money also goes to the Army and central police forces. If we remove all these, the share going to farmers (and rural area) climbs to 38%.

We can argue that farmers deserve more support from the government but we should remember that more spending on farmers would mean less spending on some other sector such as infrastructure creation, health or defense. Asking for more spending on a particular sector or segment without saying where else the spending should be cut is like suggesting more than 11 players to play in a cricket team just because 14 people deserve to play!

The government spends more than it earns anyway. Can it borrow even more to support farmers? It can but then that can lead to money not being available for industries and would increase inflation as we have explained here.

As we discussed, the government buys the grain at a high price and sells it at a much lower price. The difference is funded by money from taxes and from borrowings. If the private sector is also forced to buy at high prices and sell at much lower prices, then one of the following will happen.

  • The private sector would need to be given subsidy by the government. This will increase the subsidy bill by a humongous amount. Additionally, it is extremely likely that there would be corruption and inefficiency in the private sector operations and this loot of taxpayer funded subsidy would line the pockets of unscrupulous business people.
  • In case such a subsidy is not given by the government, the businesses will need to borrow money or put in their own money to fund the difference between the high purchase price and the low selling price. Such a business would be bankrupt in a very short time.
  • If the businesses are forced to buy at a high MSP and sell it at an even higher price then the food prices in the country would rise very sharply and would become the most expensive in the world. Additionally, unscrupulous businessmen would evade such a law and a black market would develop for food grains. Such a market would drive all ethical business people away from this business.

So how should India help its farmers to increase their income? We should start with what ails a small farmer.

A few years ago, we did a comprehensive analysis of income of small farmers and identified a simple framework for increasing farming incomes. The farming incomes can increase if farmers grow more crops and / or get more money for the crops they grow.

How to Grow more: By access to adequate water, better techniques and inputs such as seeds and fertilizers. Availability of credit is another key required input.

How to get more: Somehow reduce the monopoly powers of the buyers of farmer’s produce.

The new APMC law tries to enable exactly that by allowing buyers to buy from the farmers outside the Mandi set up to. The expectation of the law is that if the farmers get more choice of buyers, they will be able to sell their crops for more. So why are the farmers unhappy? Because they feel that the new laws are a step in the direction of reducing purchases under MSP and they don’t trust the private buyers. To understand this fear we need to appreciate a fundamental truth about farming.

Farming is one of the few businesses that buys retail and sells wholesale [1]. When a farmer goes out to buy inputs like seeds, fertilizers or labor, he is one of the Millions of buyers from the few companies that sell him inputs. When the same farmer goes to sell his produce, he is one of the Lakhs of sellers bargaining with a handful of buyers. In either of these situations, the bargaining position of the farmer is very weak. He has to accept the price that his seller or buyer is offering.

This retail buying and wholesale selling means that the farmer’s margins are squeezed. One of us tried to help out a tribal farmer in the Palghar district who attempted to grow Brinjals on his farms. The farmer would harvest the vegetables at night so that he could drive down with them to sell the Brinjals at Vashi Mandi more than one hundred kilometers away. He needed to pay the labor — other than his immediate family- a little extra to work at night and he had to pay rental for the small pickup truck that he used. Depending on the amount he harvested, his transportation and input costs per delivery were around 6–8 Rs / kg. The price he got in the Vashi mandi was often less than Rs. 7 / kg. This means that for many deliveries he ended up getting less money than he had spent! Note that the farmer had no control on the price he got at the Vashi Mandi or on the money he spent on renting the pickup truck or the wages he paid his labor.

A few of my readers may object to farming being called a business and this is possibly because they mentally have a picture of a rich person as a businessman and that of a poor person as a farmer. But that may not be the best way of thinking about farming. Farming is a business in the sense that a farmer does not get a guaranteed salary. He is subject to many forces of nature and does not have the assurance that the crop he plants will succeed. In addition, as we have mentioned above, a farmer is subject to price fluctuations both while selling his crops and while buying inputs. There is no question about it. Farming is a business and a very risky business at that.

When a business gets squeezed by both its suppliers and buyers, its margins are reduced. That is, the gap between its revenues and costs is very low. A low margin business can make a lot of money only if the volume of its business is very high. Take for example, a business of trading metal. If the buyer buys the metal at Rs. 90 / kg and sells it at Rs. 100 / kg, the business makes a margin of Rs. 10/ kg (10% in this case). If the owner of the business buys and sells 10 kilos a month then he will make a profit of only 10 x 10 = Rs. 100. However, if he buys and sells 10,000 kilos of metal then he would make a profit of 10,000 x 10 = Rs. 1,00.000 a month. To make adequate profits, the business has to deal in high volumes.

A farmer can survive and even thrive on a low margin if he sells a high volume of his produce. Now, the farmer can increase the yield or the output in his farms if he gets enough water. He can also increase the yield by judicious use of good techniques, fertilizers, etc. However, the most obvious limit to this increase is from the total land that the farmer has available for planting crops. That is very low in India. As this graphic shows nearly all of the farmers in the country own less than 2 hectares of land!

So, if it is not possible to increase your yield too much and if the market structure is against you, what do you? Collectivisation is the way out. Many farmers come together so that they can strike a better bargain with the buyers. There are many ways of collectivisation such as cooperatives, farmer producer companies, etc. but none is as effective as forming a political block.

Farmers form a large voting block in most states and one of the most effective ways that farmers exercise this voting power is to ask for support price. That is what the striking farmers are doing. They understand that increasing the number of buyers may take up the price of their produce a little bit but it would not be anywhere near what they can get from applying pressure on the government.

Summary: Farming is a business with very bad terms. Both your suppliers and buyers are more powerful than you. The only way for farmers to counter this adverse industry structure is to come together. That is what the agitating farmers are doing.

If after reading such a long note, you are still asking this question then you were not paying attention.

Of course the government is right. The three laws passed are steps in the right direction on a very long road. The purchases under MSP are very costly and the grain purchased is much more than needed. The laws allow alternates to be created.

Of course the farmers are right. They rightly sense that the system of MSP is under threat. Without the food subsidy their income would reduce and nobody likes to face such uncertainty. Hence, they are (till now) peacefully protesting to safeguard it.

_____________________

[1] We first came across this concept in the writing of Harish Damodaran. For an excellent article on risks in the business of farming see this.

We thank Ajay Dwivedi for his inputs to this story

Edit: We had earlier stated that MSP for rice and wheat was Rs. 37 / kg and Rs. 27 / kg. That is incorrect. It is the Economic Cost. Thanks reader Rajnish Sapra for pointing out the errror.

Author –

Yogesh Upadhyaya

(Yogesh Upadhyaya is one of the founders of AskHow India. Blogs are personal views.)

You can follow AskHow India (@AskHowIndia) or me (@uppi89) on twitter or me on LinkedIn

Manish Agarwal

(Infrastructure specialist & AskHow volunteer. Blogs are personal views.)

Follow Manish Agarwal (@manishbgagarwal) or find him on LinkedIn

0

Use Our Imagesfeatured

October 14, 2020


If you wish to use any of our images for research or commercial purposes you are free to do so. The use case may be a student using the image in a report or an executive using it in a presentation. We would love it if you credit AskHow for images but that is not compulsory. As far as credit is concerned, it is “Jo de uska bhi bhal, jo na de uska bhi bhala.”

We will continue adding jpegs of past and future Infocapsules here.

  1. Rediscovery of India January 26, 2020

https://drive.google.com/drive/folders/1FpSSM4Q2ELpRcnQjbcs20uK0QCB97nGi?usp=sharing

  1. Rediscovery of India August 15, 2019

https://drive.google.com/drive/folders/1f7ufoFGOU5PMliRw6wwvRoa47W4UKsVR?usp=sharing

  1. How can we put voters ahead of funders?

https://drive.google.com/drive/folders/1jsh4s4iZFU_iZdBUsu-ObKksdvi8DLDX?usp=sharing

  1. Employment data: What is the fuss about?

https://drive.google.com/drive/folders/1JpoLiBuRBLiIVvcjWYfbtIRhLnhHP9Bh?usp=sharing

  1. Rediscovery of India, August 15, 2018

https://drive.google.com/drive/folders/1QoZgThLYYL0QtOzruzdEuG9S2gLBL8HR?usp=sharing

  1. Rediscovery of India January 26, 2019

https://drive.google.com/drive/folders/1CcI8fVdQr5FCIcal51ylo0bdrZ8HeAc2?usp=sharing

  1. Renewable Energy, Not ready for Prime Time yet
  1. How can we breathe cleaner air?

https://drive.google.com/drive/folders/1b3VaDofg0ocCpHxMSJ45tDJWiHHSkhp-?usp=sharing

  1. How can police be free from undue political interference?

https://drive.google.com/drive/folders/1EGlJKFWdlSPFJbzN0YBYH0A3XARx3LT5?usp=sharing

  1. GST simplified for you

https://drive.google.com/drive/folders/1c0tpD3gVP507Mmn0muBKov9t3En-3oJi?usp=sharing

  1. How can we reduce Black Money in India?
  1. How can the small farmer’s income be increased?

https://drive.google.com/drive/folders/1TrjwZZIHAjFziHDFc72vSGSKd9Ksaunt?usp=sharing

  1. How can we have land acquisition that is fair and just?

https://drive.google.com/drive/folders/1l59Aag0d-106rWDJPjI5Xt69JLA2yr2f?usp=sharing

  1. How can women in India be more secure?

https://drive.google.com/drive/folders/1JxSNuIi1_frQYmAvGLObrqtpKxuuKTKd?usp=sharing

0

Is everyone really equal in a democracy?featured

July 10, 2020

All human beings are equal. This is the foundational principle of democracy, right? Unfortunately, it isn’t so in practice and what is more, there are no easy fixes. I am not talking about inequalities such as being born in a poor household and having no access to opportunity. I am talking about the basic structure of democracy in the sense of having equal access to power through elections. In this series on population in India, I want to touch upon the topic of how population sizes and growth make it very difficult to stick to the principle of equality of all citizens. Let us open with a simple topic — cricket and then go on to talk about voting for central government and even climate change!

Image by Mediamodifier from Pixabay

Board for Control of Cricket in India (BCCI) is in charge of governing cricket in the country. A few years ago, the Supreme Court constituted a committee — known as the Lodha Committee — to look into its functioning. One of the problems that the committee identified was that which association was a voting member of BCCI was arbitrary. For example, states like Maharashtra and Gujarat had three member associations that were allowed to vote in the BCCI elections whereas Bihar did not have any. To address this anomaly, the committee adopted the principle of ‘One State — One Member — One vote” for all elections in BCCI. This sounds fair but breaks down quickly if you look closely.

Take the case of Uttar Pradesh (UP) and Sikkim. UP, with a population of 231.43 Million is humongous. Sikkim, with a population of 0.67 Million, is tiny in comparison. Is it fair that UP has one vote — the same as Sikkim — when the number of people living in each of the 75 districts of UP is many multiples of the total population of Sikkim? You don’t even need to add to it the fact that it is either too cold or too wet for most of the year in Sikkim and hence, cricket is not a very popular game in the state. The few fans of cricket in Sikkim have disproportionate power compared to the cricket fans of UP and we can easily find many such examples.

To be fair, the Lodha Committee recognized the challenge posed by differences in population sizes, interest and infrastructure in different states. It allowed for the money transferred to the state associations from BCCI to be different. It also agreed that the some of the larger states could have more than one team in national competitions and a few small states could combine to form one team. However, I believe that such sensible suggestions can easily become secondary to political and monetary considerations when the formal power are not divided as sensibly. As it stands, in the plate division of Ranji Trophy, the state of Bihar competed with nine other teams from states like Aruncahal Pradesh, Nagaland and Sikkim. The population of all these states put together is a fraction of Bihar.

I must say here that it is not easy to come up with an alternative to One State — One vote principle. However, there is no doubt in my mind that the current situation is neither efficient nor fair.

If you think cricket is ‘just a game’ (Gasp!), then let us take the very serious topic of representation in democracy. In India, voters elect their representative — the Member of Parliament (MP) at the national level. MPs make laws and also elect the Prime Minister. Earlier, the constituency sizes used to be changed every ten years to ensure that roughly the same number of people were represented by an individual Member of Parliament (MP). This process is called delimitation. In 1977, the constitution was amended (42nd amendment) and the delimitation of constituencies was frozen till the 2001 census. The 84th amendment in the constitution in 2003 extended the freeze till 2026 [1].

These amendments mean that even as the populations of the Northern and Eastern States have increased at a much higher rate than the population in the Western and Southern states, the number of MPs from each state has remained frozen. The population of UP is 231 Million and it is represented by 80 MPs. Tamil Nadu (TN) has 71 Million people and it has 39 MPs in the parliament. The interests of 1.8 Million people in TN are represented by one MP on an average whereas in UP a MP represents 2.9 Million people. A more than 50% difference! Remember that each of these MPs has an equal say in selecting the Prime Minister of the country.

As with cricket, here too it is easier to identify the problem then it is to propose solutions. The idea behind freezing the delimitation was to ensure that the Western and Southern states, which have been faster in reducing their fertility rates, are not be penalized. If states like Uttar Pradesh and Bihar, which have seen a much sharper growth in population, keep increasing their share of total number of Members of Parliament, then they will get proportionally more power. This would mean lesser power for the states which have developed faster and have also slowed their population growth and that does not sound fair too. Especially, as this power includes the power to increase their share of tax revenues and that is where things get really interesting.

Many taxes, such as Income Tax, Customs Duty and Excise Duty go exclusively to the central government. The Centre transfers part of this money to states. What share of the money goes to the state and which state gets how much is determined by Finance Commissions.

There are opposing rationales at play in this decision. On one hand, poorer states require money to improve their infrastructure and without such improvement they would remain poor. Money is not sufficient to improve the economy of the poorer state, it has to be used honestly and efficiently too. But the money is definitely necessary. It would be very difficult for a state to improve its economy for example, if it did not have all weather roads connecting its villages or if it did not have reliable electricity for all its villages. Poorer states also have a higher fertility and a reduction in poverty would contribute to reduction in fertility. On the other hand, more developed states are bound to be resentful if they think that the poorer states are taking away most of their hard-earned money.

The Fifteenth Finance Commission came up with a decision that tried to balance these forces.

As can be seen, the commission moved from the 1971 Census to 2001 Census, recognizing the higher number of people in states like UP and Bihar. But then, it introduced another criterion called demographic performance which rewards Western and Southern states for lower fertility rates. The weightage for Income Distance (relative poverty) is also reduced. All in all, it is not clear whether and by how much would different states benefit or lose out in this new formula. Maybe this gives a clue of how to take such tough decisions. Don’t change things too much and hide the decision behind dry committee reports and moderately complex Algebra! It helps if there is a sense of being in it all together as a part of one country. A sense which is missing when it comes to international issues such as Climate Change.

I routinely see headlines that say that India is now third highest Carbon Dioxide emitter in the world. Such headlines say absolutely nothing except that India has a large population. New Zealand, for example, has a population which is less than half of many cities in India. Is it a surprise that their Carbon Emissions are lower? What we should be comparing is per capita emissions and the per capita rank of India would be much lower than all developed countries.

There is a further complication. CO2 is a stock pollutant. That is, CO2 once released in the atmosphere, stays there for a long time. NASA estimates that it remains there for between 300 and 1000 years. Thus, even if countries like India are today releasing large amounts of CO2 in the atmosphere, their contribution is a very small percentage of total CO2 which has built up in the last two centuries. This is because the more industrialized nations have been releasing CO2 for centuries and have built their economy and infrastructure on the back of this release. In absence of development, countries like India lose many citizens to much more basic problems like communicable diseases and poverty. Is it fair, to ask these countries to share the same burden as the developed countries?

Like the previous examples, it is easier to come up with a problem description rather than a solution. And that is not surprising. Complex problems do not have the structure “You committed this crime. This is your punishment” and hence cannot have one sentence solutions based on abstract principles. A solution may be found by people talking to each other, sometimes angrily and sometimes calmly. And listening.

And such talking and listening does happen in the world once in a while although the world could do with more of it.

Author –

Yogesh Upadhyaya

(Yogesh Upadhyaya is one of the founders of AskHow India. Blogs are personal views.)

You can follow AskHow India (@AskHowIndia) or me (@Uppi89) on twitter or me on LinkedIn


[1] Since 2003, the freeze is for interstate delimitation. The constituency boundaries within states were changed to allow a more equal representation within states.


0

Mithi River: Another health crisis that needs COVID like responsefeatured

July 09, 2020

What is needed to increase credibility of the Action Plan for cleaning Mithi river

Now that the monsoons are here, you will probably see the “Mithi River” in discussions more often. The overflowing of the Mithi causes much “traas” for the Mumbaikar – traffic jams, stopped trains, inundation of houses in low lying areas, etc. However, the chronic pollution of Mithi causes more damage all year round; I am hoping that this will get more attention in context of COVID. Several lakh people live near this stinking nullah, and wash themselves and clean utensils in it. With pollution level over 25 times acceptable level due to flow of human waste, Mithi has been described in a NEERI report as “a hub for harmful diseases like dengue, malaria and chikangunya, etc”. The same sewage flows into the city during flooding. It also flows into the sea all year around, impacting marine life also. If there is a need to bring the health crisis closer home, the same infected people also work in your homes or offices, serve you in restaurants, deliver your parcels, etc.

Surely there must be a plan to clean the Mithi? And there is! In March 2019, MPCB has submitted its “Report on Action Plan for Mithi River” to CPCB. The Report spells out the following “deliverables” by 2023 (with possibility of slipping to 2025)

  • 100% sewage collection and treatment
  • 100% Municipal Solid Waste (MSW) collection, transportation and treatment
  • Achieve river water quality of bathing standards by 2023
  • Augmentation of river flow and restoration of water quality by 2024

However, there are reasons to be skeptical about the success of the plan until reasons for insufficient success of previous plans are underlined and addressed.

  1. History of several reports and action plans. NEERI prepared a report in 2011, which reviewed 12 reports, since 1974 (6 of those after 2005), and highlighted that many of the recommendations in those reports continue to remain relevant, but not-implemented. Another decade later, while some of the actions for deepening of Mithi (to increase water carrying capacity) have been implemented, most recommendations that would improve water quality remain work-in-progress.
  2. Lack of detail on what will be done differently this time. Both measures, cleaning of sewage and collection of solid waste, have been on the city’s agenda for two decades.
  • The 8 operational Sewage Treatment Plants (STPs) in Mumbai, for example, produce output that has roughly twice the permitted level of pollutants. Neither the plan, nor Maharashtra Pollution Control Board’s report on inadequate performance of existing STPs, diagnose why this is so, or clarify why this would not be the case in future. A second challenge is laying of sewage lines in slums, and keeping pumps functioning effectively, to transfer sewage to the STPs. Both these issues will require more than just funds being allocated.
  • Similarly, insufficient solid waste treatment capacity, and inability to identify land for scientific landfill, have been hurdles to preventing solid waste being thrown into the river. A recent report by Praja highlights that 37% of Mumbai’s solid waste still remains untreated, and that the Deonar dumping site is now 88 years old, while the prescribed active landfill lifespan is 10-25 years.

3. No change in regulatory mechanism to enforce accountability. Maharashtra Pollution Control Board (MPCB), which is authored the Action Plan, is a regulator, with little role in actual implementation of the plan. The implementation responsibility is with Water Resource Department (GOM), Urban Development Department (GoM) and Municipal Corporation of Greater Mumbai. The plan mentions the following –

  • RRC (River Rejuvenation Committee) has asked Water Resource Department (GoM) to maintain minimum e-flows and watershed management, plantation on both sides of the river and setting up of bio-diversity parks
  • MCGM has proposed budget of 4000 Crores for 8 STPs, with completion by 2024-25
  • UDD has approved DPR of 388 Urban Local Bodies for Solid Waste Management. 2560 Crores approved, and solid waste management issues will be resolved by December 2019

3(a) These agencies face conflicting priorities and challenges; and State Pollution Control Boards rarely exercise their powers against other State agencies. The chiefs of the implementing agencies, in fact, sit on the Board of MPCB. The Mithi River Development & Protection Authority (MRDPA), formed after the 2005 floods to clean up Mithi in 10 years, finds no mention in the 2019 Plan.
3(b) Courts and NGT have also been particularly active; but by their nature, they are more effective in preventing “wrong actions”, than in driving the right actions in a time bound manner. For example, in August 2017, the Supreme Court ordered stopping deepening, widening and blasting operations in the river, after Rs 1200 Crores had been spent on these to increase the water carrying capacity of the river.

So, how can the plan be made more credible, then. In addition to addressing the above issues, it would help to have a more detailed plan, with intermediate timelines, and with regular progress updates. This would help ensure that this important issue remains center stage round the year, instead of only during the monsoons. For example, the tenders for procurement of STPs got cancelled in March (losing over 6 months of effort), and there is no visibility on the revised timeframe. We have all got used to daily updates on the COVID numbers. We need to get used to monthly (or quarterly) updates on the progress of cleaning Mithi also, instead of waiting till 2023. We would need to be as interested so the onus is on us too.

The Action Plan needs to be more comprehensive, too. NEERI’s 2011 report expressed a concern, that there is no final vision for Mithi river rejuvenation. Perhaps that has also been a reason for piecemeal implementation of various components. A report in Hindustan Times in December 2009 had the following by-line – “By 2011, you could be sailing on the Mithi, which would be surrounded by green walkways and people strolling on bridges connecting its bays”. While the latest Action Plan offers no such paradise-like vision, “water quality of bathing standards” and “augmentation of river flow” are elements of a “vision” in the 2019 Action Plan. There is also mention of plantation on both sides of the river and setting up of bio-diversity parks, though these are not listed in the “deliverables”. Various expert reports (referred in point 1 above) have recommended creation of a 50m buffer zone on both sides of the Mithi. (In its 2006 report, IIT Bombay suggested a 200m “ecozone” on both sides). This is certainly very difficult to do, given socio-economic and legal issues, but the Dharavi Redevelopment Plan continues to be on the Government agenda (which would, presumably, also create a no-building distance from the river edge).

In summary, the action plan would be more credible, if it clearly articulates responses to the “how” of cleaning Mithi? How will 100% sewage be collected and the STPs remain efficiently operational? How will 100% solid waste be collected and treated and landfilled? How will the banks of the Mithi be made into a buffer zone? More on the challenges in addressing these “Hows” in our infocapsule that will follow.

Author –

Manish Agarwal

(Infrastructure specialist &AskHow volunteer. Blogs are personal views.)

_________

Reports referred above can be found at

https://www.mpcb.gov.in/sites/default/files/river-polluted/action-plan-priority/priority_I_MITHI_28052019.pdf

https://mmrda.maharashtra.gov.in/documents/10180/11271261/6/dd259fbe-03f0-49ab-b034-dc4d771c36a3?version=1.0

https://www.praja.org/praja_docs/praja_downloads/Status%20of%20Civic%20Issues%20in%20Mumbai,%202020.pdf

0

Matters of Life and Death in Indiafeatured

June 29, 2020

This is the ninth post in a series on population in India. Each post can be read independently. The links for the first eight posts are at the bottom of this one.

How long would an Indian born today expect to live? How many Indians die every year? What are the leading causes of death in the country? The Covid-19 pandemic has focused our attention on death and I thought this would be a good time to answer these questions. This post is a part of a series on population in India. Let us begin with life expectancy.

How long can you expect to live?

How long you expect to live depends on how old you are. Life expectancy at birth is the expected life of a person born in a particular year in that year. The life expectancy of a person born in 2015 in India is 69 years.

This figure is an average. Unfortunately, many will (and have) die younger and that means that the life expectancy of those who live increases. For 2013–17, SRS estimated the mean life expectancy at age 10 as 71.8, at age 50, 75.8 and at age 70, 81.5.

Life expectancy has increased across the world in the last two centuries, it is believed that this increase was driven mainly by improvements in sanitation, housing, and education, causing a steady decline in early and mid-life mortality, which was chiefly due to infections. This trend continued with the development of vaccines and then antibiotics. India has also seen a near 75% increase in life expectancy since 1960.

As we will see later, many Indians still die from infectious diseases and I suspect that we are yet to see a significant impact of improved sanitation!

The life expectancy varies across states, with Kerala leading the way. In 2013–17, it had an expectancy of 75.2 while Uttar Pradesh was only 65.0. You can expect to live longer if you live in an urban area rather than rural, with the numbers being 72.4 and 67.7. Women are expected to live longer than men; 70.4 versus 67.8.

Now to the next question, how many people die each year?

How many die and why?

The Sample Registration System estimated the Crude Death rate (CDR) for the country at 6.2 in 2018. That is, there were 6.2 deaths for every 1000 people in the year. For a total population of 1.36 Billion, this comes to 8.4 Million deaths every year or 0.7 Million deaths every month. Incidentally, the CDR is much higher (more than 9) in more developed places like Europe, United States and Japan as their populations are significantly older. What do people die of in India?

India has a challenge in determining the cause of death. SRS estimates that only twenty percent of deaths are medically certified. I understand that even in the medically certified cases, the doctor may not be very precise in listing the cause of death. So how do we estimate the cause of death for the whole country?

SRS conducted ‘Verbal Autopsies (VA)’ on the deaths that occurred in its sample. This is a conversation with people close to the dead person in order to determine the cause of death. This method has its inexactness. There is also the impreciseness of the whole sampling process in general, and the results of SRS should be taken with a grain of salt. However, I do think that these results are indicative.

As can be seen, Cardiovascular diseases are the biggest killer in the country. In some sense, this is a good sign. It means that infectious diseases, which may kill more young people than Cardiovascular diseases, are not killing as many as they used to. The impact of infectious diseases is still very high though, and many of them may be contributing to other causes of death by the way of reduced immunity and general ill health.

Note the nearly 4% of deaths are from Tuberculosis. That would translate to roughly 3,00,000 deaths a year or 25,000 deaths a month. As I write this post at the end of June 2020, the deaths from Covid-19 are less than 15,000 in three months. Many people have used this comparison to say that Indians may be overestimating the danger of Covid-19. This topic requires a separate post by itself but I will mention one fact that many people miss in such discussions. The challenge of the covid-19 is that it spreads very fast. The serial interval, or the time between the symptoms of first patient and second patient is very short. For Covid-19 this is estimated to be around 4 days. The estimates of the median serial interval for TB vary from 0.57 to 1.65 years! [1].

Thus, even though the percentage of severe cases may be low in Covid-19, the total number of such cases becomes so high that it puts a huge load on hospitals. This is being seen in Mumbai and Delhi currently.

Summary

· The life expectancy at birth in India has been steadily increasing and is now nearly 70 years.

· About 84 Lakh people die in India every year.

· Cardio vascular diseases are the biggest killers in India and infectious diseases cause many deaths too.

Author –

Yogesh Upadhyaya

(Yogesh Upadhyaya is one of the founders of AskHow India. Blogs are personal views.)

You can follow AskHow India (@AskHowIndia) or me (@Uppi89) on twitter or me on LinkedIn


[1] I first came across the concept of Serial interval in this blog. Click through for a good description of difference between risk and uncertainty also.


0

Opportunity in the crisis – How will India grab a share of global supply chainsfeatured

May 14, 2020

Much has been said about the opportunity for India to grab a share of what China will lose, in the global supply chain. The process will not be quick, as supply chain diversification will happen only as when new investment is made in expansions. However, India needs to rapidly progress on several parallel tracks to be ready with a more attractive proposition than in the past.

  1. Large domestic market is key to achieving scale

a) Imports have been more competitive than domestic manufacturing for a range of products like cellphones and household goods; computers; telecom equipment; computer accessories; toys, etc. These are also products that make up bulk of China’s exports to the US.

b) Our policies have (i) artificially differentiated between export and domestic markets; and (ii) encouraged small over large manufacturing. Any steps that remove these distinctions, and trigger growth in domestic demand, are good for competitiveness of manufacturing.

c) Disrupted imports from China, and “import barriers” being acceptable as the new-norm, are tactical opportunities, but should not be mistaken for a permanent advantage, moreso as India will want access to other markets, as trade treaties get renegotiated.

d) The pandemic also provides the opportunity to rapidly scale up on sectors that have otherwise been neglected. Medical devices is one such sector, whose manufacturing could cluster around healthcare R&D. Similarly, India’s food processing sector could leapfrog by upgrading the agri supply chain and cold chain, while bringing prosperity to parts of the country which otherwise export seasonal labor.

2. Smart prioritisation can address disadvantage of logistics cost

a) Logistics cost and time has been a key hurdle in India’s competitiveness. On land, more cargo travels on road than on rail, which is inefficient. Our ports don’t provide sufficient scale for the largest ships to call, often requiring transshipment at another port, which further adds to cost and time. (India has only one port that handles over 100 mn tonnes per annum, and it does not feature in the world’s 20 largest ports. China has 11 in the 20).

b) Railways need to run time-tabled cargo trains. The reduction in passenger transport provides the opportunity to prioritise freight. This has to become permanent by proper scheduling of passenger and freight trains.

c) The drop in global demand could reshape global shipping norms, as liners re-optimise routes to maximise cargo, and re-visit pricing for ports which do not provide sufficient volumes. Indian logistics industry needs to evaluate whether the ability to aggregate cargo at certain prioritised ports to attract ships more often. More frequent ship calls at certain Indian ports can be a big advantage over smaller countries that do not have similar volumes. Success of this strategy would critically depend on prioritised rail services and coastal-shipping from other ports to feed cargo into these ports.

d) To further improve timeliness of delivery, Railways should also be able to move smaller parcel sizes (say 2 wagons only). Similarly, until global trade volumes pick up, India may also need to consider the state-owned shipping corporation to play a strategic role in ensuring timely delivery of Indian exports, by sailing even if it does not have full load. The benefits of this may exceed cost in several cases.

3. Role of private sector is critical in making Infrastructure concerns history

a) The slowdown in demand is an opportunity for infrastructure supply to rapidly catch up and become surplus. The National Infrastructure Pipeline underscores the shortage of shovel-ready-projects. More importantly, the manner in which the Govt deals with existing infrastructure investors impacted by the pandemic, will shape the sentiment of future infra investors. Infrastructure in India has come to be seen as a high risk asset class, thereby attracting investors / operators with higher return expectations. To attract institutional investors (who also bring higher levels of corporate governance), it is imperative now to demonstrate that critical infrastructure investments will be treated differently from investments in other sectors.

b) While large volume of infra has been built, its operations & maintenance is often inefficient. For example, in spite of having surplus power, the power supply quality often lags that in Vietnam (even as it meets the standards required by the regulator). Surely this can be easily fixed for A-grade industrial parks. Similarly, the roads connecting industrial parks are in poor condition in many cases. Performance based contracts with private sector operators is critical to fix this. Future PPPs (whether requiring investment or only O&M) need to significantly increase focus on service quality. Private industrial park operators like Ascendas, GMR, Mahindra, SriCity, etc need to be made partners in this program.

c) Third, the burden of cross subsidies (in power, railway, toll, etc) contributes to eroding competitiveness of Indian industry. The industry revival plan would do well to address this issue comprehensively. (In many countries, the power tariff for industry is lower than that for domestic consumers, because it costs lower to supply power at higher voltages).

d) The Central and State Governments have been planning and developing world-class industrial parks for several years (initially, DMIC, and then several more corridors). Large areas of land have been identified, globally reputed planners have designed the infrastructure. India has surplus power, high quality national highways, world class airports. Now is the time to offer a menu of high quality locations to investors, with a mindset of competing with other countries, instead of within States.

4. To build credibility in Ease of Doing Business, existing industries have to become spokespersons

a) Red tape, including tax terrorism, continues to be a big concern for investors. While India leapfrogging to 63rd rank on EODB is a big change, in private conversations, concerns are still raised. That the rankings capture only Delhi and Mumbai, is one key issue, even though the State wise ranking has spurred initiatives across the country.

b) An independent comparison of the menu of high quality locations (mentioned above), with competing locations, would give a better view to investors. (Competing locations could include Malaysia (currently 12th ranked), Taiwan (15), Thailand (21), Kenya (56), Mexico (60), Vietnam (70) and Indonesia (73)). As discussed above, private sector operators should be roped in to the priority industrial parks, with empowerment and accountability / incentives for exceeding service levels.

c) Existing industrialists (foreign, Indian; big, small) need to become genuine endorsers of India’s ease-of-doing business. This will require rapid improvement in factors like Contract Enforcement also.

5. Supporting the revival is necessary, but should not bring back inspector-raj.

a) Several businesses will face a challenge rarely seen before. Unit costs would increase due to higher cost of compliance with sanitisation requirements (including readiness for shutdowns and restarts, longer working hours), suboptimal utilisation due to social distancing and getting only part of the workforce to come in, and lower than normal demand. On the other hand, prices may need to be lower than normal to stimulate demand. Many businesses, particularly MSMEs, would not have the deep pockets to sustain this until proper equilibrium is reached. The manner of Government intervention will need to be carefully designed to avoid distortions, while protecting the needy.

b) Input linked interventions (like moratorium on debt servicing) impact different businesses to different extents (for example, depending on how much they rely on formal bank credit). However, there could be several steps that are not sector dependent such as (i) minimising the health-infra costs imposed on industry, by providing screening, sanitising and testing etc inputs, and reducing the productivity loss due to social distancing. (ii) giving flexibility to employers to negotiate with workers to achieve a balance in sharing of pain, while supporting workers through Direct Benefits Transfers. Limiting labor law reforms to new units may have a limited effect.

c) Sales linked interventions (like GST reductions) allow the demand-supply dynamics to play out, as the industry seeks its new equilibrium. The Govt’s role in WTO renegotiation (in whatever new avatar it may take), and sector specific and /or multilateral trade treaties, will be critical to success.

The above list perhaps looks familiar (improve infra; reduce red tape,etc). But the opportunity, and imperative, to make rapid progress on them, is perhaps better today than ever before. The crisis has shown that high impact decisions are possible; and that similar extreme measures are needed to pull out of the economic abyss. Problems that have not been solvable through the soft approach, may be more malleable in a crisis.

Manish Agarwal (Infrastructure specialist &AskHow volunteer)

All views are personal.

0

How is China doing it?featured

May 06, 2020

India has started removing the restrictions imposed on its citizens to slow the spread of novel Corona Virus. For inspiration, it could look towards countries like Hong Kong and New Zealand, which have been successful in tackling the pandemic. However, these countries are small. The population of both is lower than that of many cities in India! Perhaps, India should be tracking China — the only country with the size and complexity that matches India.

China has opened up many of its cities and life there is ‘normal.’ What did they do? What are they doing now to prevent a second wave of infection? Is it working? I wrote a very small post on this topic a week ago. My intention was to use the post to spark conversations with people living in China. I hoped to get some insights into what day to day life is in the country and what the state is doing to combat Covid -19. Here is a post based on first set of interactions.

But first, let us tackle a few questions that I got from people. The first of them being ‘Do you trust China?’

But, but, but…China?

Are China’s Covid 19 numbers trustworthy? The fact that more people are dying in US and Europe every week, than have died in China since the beginning of the disease, makes people very suspicious about the declared infection and mortality numbers from that country. However, I think we can side step this question. The numbers out of China may or may not be reliable but the actions of the government (s) there speak volumes. China was first to impose a lockdown and it was a lockdown that many called draconian. In fact, I would argue that the world made a mistake by relying on their numbers and not on their actions!

Another question I got is a version of, “Do you think a democracy can replicate what China is doing?”. Maybe yes, maybe no. I believe the question is premature. You can answer it only if you know what that country is doing and most of us don’t. Also, even if you find that some of the Chinese actions are not replicable elsewhere, it is useful to know what those actions were trying to achieve and find a substitute.

The third objection I got from my connections was perhaps the most meaningful. Most cities in China have been open only for around couple of months. Maybe the second wave infection numbers are not large enough to be noticed? Possibly. But it makes sense to begin studying what China is doing. If they reimpose a lockdown a few weeks from now, then we would have some sense of how effective or ineffective the measures taken by the Chinese were in slowing the infection.

Given this background, let us look at what the situation is in China. As far as I can make out, the country has unlocked many of its cities. What does it mean?

Situation in China

Friends and friends of friends [1], living in four different cities in China tell me that their life is normal. What does that mean? It means that people attend offices as they used to before the crisis. It means that that they take public transport to work although they prefer cabs. It means that they can travel anywhere in the city, although in general they prefer not to. It means that they can go to restaurants, although with some restrictions. So, the new normal is different from the Before Corona (BC) times but it is also very different from what life is currently in India and from what I understand life to be in most of Europe and United States.

News reports and data support these anecdotal accounts. Media houses have come up with video reports on cities, including Wuhan, that show many people on road, in offices and in restaurants. Data on economic indictors like oil consumption and air pollution shows that the economic activity is much higher than it was during their lockdown.

Of course, treating a country of 1.4 billion people as a monolith is gross oversimplification. There are differences between the level of restrictions in cities and provinces. Beijing and the north in general have had more stringent restrictions than Shanghai for example. Heilongjiang in North has seen a surge of cases in the last month and Wuhan, understandably is the most cautious. But in general, life seems to be returning to normal with even gyms and foot massage parlors being opened up in Guanzhou!

China’s strategy to tackle Covid — 19 has had two distinct phases. The lockdown phase to sharply reduce the number of active cases and the second phase in which the effective transmission rate of the disease is kept very low. I should note here that this is very different strategy from just reducing the effective transmission rate or ‘flattening the curve’. Once you have a high number of cases, reducing the effective transmission rate to below 1 can still mean lot of cases. For example, if you have 1,00,000 infected and the transmission rate is 0.9, there would be 90,000 infected in the next round! China has aimed to first reduce the active cases to near zero and then open up while trying to keep the transmission rate very low.

The lockdown phase

The country was ‘lucky’ that the threat of outbreak outside Wuhan became serious only around the third week of January which was the beginning of the Chinese New Year (CNY). The CNY time is when migrants from villages go back home and the offices and factories are closed. Big cities become relatively deserted and most businesses take a break. The Chinese governments extended the holidays and strictly prevented intercity travel. They also used the shutdown period to build capacities for treatment and to trace all people who had travelled from Wuhan and their contacts and isolate / quarantine them.

The measures taken, varied from city to city and even within cities, but some common themes that I could find were

· Restricting people from leaving their homes. In many parts of cities, it meant that each household was issued one pass, which could be used by one person in the household, once in two days. This restriction was supported by what is probably the best home delivery supply chain in the world. Unlike, what I have seen in India and heard about in parts of US, the home delivery system kept delivering. It slowed down from forty-five-minute delivery to next day delivery, and there were restrictions on the number of items you could order, but there was never a situation where you couldn’t get deliveries at all. The delivery protocols were put in place early. Staff had to wear masks and would not deliver at the doorstep but at a designated point from where the householder could collect their deliveries without contact. Presumably, there were strict protocols for the delivery folk while collecting the goods too.

· Severely restricting interprovince movement. The only interprovince movement allowed was for logistics purpose and in many provinces, trucks could move only within their own province and had to offload to other trucks in case of interprovince movement. The severest restriction was in case of Wuhan where a truck driver taking supplies into the city had to undergo fourteen days of quarantine on return. The trucking companies could afford to do this as the lockdown meant that they had many more drivers available than they had engaged trucks.

· Temperature checks and isolation. Temperature checks were, and in most cases still are, everywhere. You had to get your temperature checked if you entered a store or an office. Your temperature was checked if you entered a city and your temperature was checked even if you went into the parking lot of your building. The manpower for this temperature check was provided by the premises for private spaces like offices, or by the Communist Party for public spaces.

· Control by the Chinese Communist Party. The cities are divided in grids and each grid was assigned to a set of party workers. The party workers would run temperature checks in public spaces and also trace the contacts of infected person. Many local level clinics were opened that did a first level screening and in case of fever sent the patient to a separate hospital.

· Isolation. To my mind this is the biggest difference between China and the West and to some extent even India. Anyone with a high temperature was immediately taken to a separate hospital or a separate ward in the hospital where they were isolated from other patients and were tested by staff wearing full protective gear. If they tested positive for Covid -19, the contact racing machinery would jump into action and ensure that all of their contacts were traced and tested. Many times, repeatedly tested.

So, what is the state doing to ensure that society does not have another uncontrolled outbreak? The four pillars of Chinese state response seem to be Quarantine, Isolation, social distancing and masks and use of Mobile apps to enforce the above. Let us take each of them in turn.

Note: In each of the sections, I have first summarized what I learnt from my interactions and then jotted down the questions that came up in my mind.

Quarantine

China started compulsory quarantining of its foreign visitors a few months ago. Earlier it depended on the country of origin but now everyone has to compulsorily undergo fourteen days of quarantine. From a couple of examples that I have heard, you are tested when you enter the country and if you come up negative, you check yourself into a hotel room and don’t come out for fourteen days. Food is delivered at your doorstep three times a day. At the end of fourteen days, you are tested again and have to be negative for you to be let in with the general population.

A similar process exists even for people migrating within China. If as a migrant worker, you have to go back to work, you have to first scan your QR code before you get on the train, and then on reaching the destination, you need to get tested and quarantine yourself for at least fourteen days. Many businesses have earmarked dormitories for enabling such quarantine.

My questions / comments: I can understand high margin businesses, such as Foxconn, absorbing the cost of fourteen-day quarantine for their workers. But I am not sure how a low margin business like a garment or furniture manufacturer can afford to keep workers idle for two weeks. From what I hear, most such businesses are making do with local workers. Right now, this is possible, as their own markets across US, Europe and Asia are under lockdown. It would be interesting to see how this plays out as and when demand for the low margin factories starts picking up.

It is worth noting here that Singapore, a tiny country compared to China, had Covid-19 under control till the disease reached the dormitories of its migrant workers. Media reports state that nearly 90% of its cases are in migrant workers and one reason is the cramped conditions in those dormitories. I imagine that such cramped living conditions exist in China too, both in its dormitories as well as in its poorer non-migrant homes.

I am also curious to know of the actual experience of quarantines. There are stories that even in a supposedly disciplined culture as South Korea, many people broke quarantine. People would simply leave their phones at home when they were breaking quarantine. The problem was severe enough for the country to start making people wear tracking bracelets. It is likely that a much larger and more heterogenous country like China also has this problem.

Isolation of suspect cases

As I mentioned earlier, the most important difference between China and countries in the West in their Covid strategy may be the early use of Isolation wards. People are encouraged to report symptoms, such as fever, very early. My contacts spoke of cases where a couple of days of fever was reported to local authorities and the hospital send a vehicle and personnel in Personnel Protective Gear to take the patient to an isolation ward. The patient was tested over two to three days and during the time was kept completely isolated. Only when the doctors were convinced that the patient was not suffering from Covid -19 was the patient allowed to rejoin their family. The thinking seems to be that in-family transmission is significantly responsible for spreading the disease and hence, it is very important to break the chain early.

This is in sharp contrast to what I hear from my friends in the West where suspected patients are asked to remain at home unless their condition requires hospitalization.

Of course, the Chinese strategy cannot work if you already have a very high number of cases in your state / county. But as far as I can make out, even states / provinces in the West, which currently have a low number of cases, are not trying to implement this strategy.

Masks and other social distancing

Apparently, masks were everywhere. The people I talked to said that they rarely, if ever, see anyone not wearing a mask. In the colorful phrase of one gentleman, “It seems that nowadays babies come out of their mother’s womb wearing masks.” I should note here that in some provinces, masks are compulsory only in enclosed public places like malls and elevators.

There are reasons to think that masks might be the cheapest and the most underrated public health intervention. Nicholas Nassim Taleb, explains here that even if a mask reduces the probability of infection by only 50%, if two people wear them then the probability of them infecting each other reduces by 75%. The benefit of reduction in transmission rates compounds as more and more people wear masks.

Empirically, the countries that seem to have the disease in control, like Hong Kong, Taiwan and South Korea, all have a widespread adherence to the ethic of wearing masks in public space. Tellingly, Singapore, which has been struggling with a sever outbreak in its migrant worker population living in dormitories, made masks compulsory only recently. Of course, many more factors are surely at play in all these countries, but to my mind, cultural and / or legal enforcement of wearing masks in public spaces is a low cost and potentially high return measure.

Even in Europe, the Czech Republic seems to be doing better than its neighbors and one of the reason could very well be the high emphasis the country’s culture has placed on wearing masks.

The strangest reaction to masks has come United States and it starts right from the top. President Trump refused to wear one even as his wife urged all Americans to do so. Vice President Pence, the head of White House Corona virus task force, did not wear one while visiting Covid-19 patients! And then, there is the case of a shooting after an altercation on wearing masks.

China has also put in place other norms for social distancing such as ensuring restaurants work only to 50% of capacity and that public transport options do not get full. However, I think the implementation of these norms may be uneven at best. People are suggesting that they already see crowded buses and trains and that as the economic activity picks up, social distancing may become more difficult. After all, if you reduce the number of people in train coaches, you would be crowding them on stations!

My questions / comments: There are some subtleties in use of masks. When I step out of my apartment to buy groceries, I see a very high usage of masks but the situation becomes more complicated if I look closely. People remove their masks when talking or sitting with their regular colleagues. For example, watchmen talking to other watchmen in apartment complexes and workers sitting idle at construction sites. It is almost as if, ‘I know this person very well and he will definitely not give me the disease.’

I bring this up, because in a video on Wuhan post Covid, I saw a number of senior citizens sitting together without masks (around 5.50). It is possible that the video maker used old coverage but if it is not the case, it was the worst demographic to do that. Hence, my question, how does China deal with the instinct of not wearing masks with ‘friends?’ How does social distancing continue when no cases are discovered in your neighborhood for a few weeks?

Mobile based tracking

Over the period of last few weeks, the Green, Red and Amber codes on mobile phones have become central to people living in China. These QR codes are available on existing applications from Alibaba and Tencent. You need to scan your QR code before getting in and out of offices, public transport and sometimes even localities. Trains in Shanghai have separate coaches for Green and Amber status. It is not clear how your status gets assigned — ostensibly it is on the basis of your own quarantine status and your recent proximity to others who have Amber or Red status or if you were in touch with someone whose status changed to Amber or Red.

The Chinese state has also seems to be using mobile data extensively for contact tracing. If you test positive, then your movements in the past few days can be tracked based on your mobile data and all other mobile owners who spent time with you identified. This would clearly be the most difficult measure for most countries to replicate.

Testing

Underpinning the four pillars of China strategy is widespread and extensive testing. One of the persons I talked to told me that in the last couple of months, he has been tested thrice. The governments tests you, if you come from some other country or if you migrate from one city to another. Your employer may test you before allowing you in the office and even some private schools have tested the kids and teachers before restarting. Of course, if you display any fever like symptoms, or if you are in contact with a confirmed patient, you would be tested multiple times. This is all PCR based tests and there is also thermal scanning.

The most widespread testing seems to be testing of temperature using thermal scanners. China used it extensively during lockdown and continues to use it even today. A PCR test takes time and is impractical in a place that sees many visitors and thermal scanners continue to be the first line of China’s defense.

My questions / comments: One big advantage of the country seems to be its manufacturing capabilities as it has been able to develop a very high number of test kits. China has also been able to speed up its testing, in many instances getting results in hours rather than days. Clearly other countries have some catching up to do.

One question that comes up is how does the country tackle false positives? If the disease incidence in an area is low then it is possible that the false positives outnumber the true positives if the testing is widespread and of asymptomatic population.

One of the diabolical things about Covid 19 is that you could be asymptomatic but still be a carrier of the virus. A thermal scanner wouldn’t work in identifying such a person. If however, the extensive use of thermal scanners is effective, could it be that asymptomatic carriers do not shed as many viruses as someone running a temperature?

Summary

· China has opened many of its cities and life there is ‘normal’

· We may or may not trust China’s numbers but should be trusting their actions.

· It is worth studying what the country is doing even if that is not replicable 100% in other societies and even if there is a second wave of infections in that country.

· China’s actions started with CNY. The cities were relatively deserted and offices were closed. The Chinese government extended the holidays and also ramped up capacities as well as tested and tracked all visitors from Wuhan.

· The extended stay at home was at least partly enabled by a very extensive and efficient home delivery infrastructure.

· One crucial difference between China and other countries is isolation of all suspected and confirmed Covid -19 patients.

· Cities are quarantining all visitors whether from overseas or from other cities.

· Masks are ubiquitous. Social distancing is becoming more difficult as more people use public transport.

· QR code-based apps underpin China’s efforts.

· Extraordinarily large number of tests performed in the country and an extensive use of thermal scanners.


I have written this post after talking to people living in China, directly and indirectly and by reading articles and watching videos. My idea is to spark a conversation. Please do point out errors of omission and commission and help take the conversation forward.


Related content: What would you do?

Author –

Yogesh Upadhyaya

(Yogesh Upadhyaya is one of the founders of AskHow India. Blogs are personal views.)

You can follow AskHow India (@AskHowIndia) or me (@Uppi89) on twitter or me on LinkedIn

0

What did China do?featured

April 24, 2020


I am getting many stories from China suggesting that the cities in the country are normal. Friends of friends living in different cities are going to their offices. They are traveling all over the city in public transport. They are going to restaurants. This, when the rest of the world is in lockdown. So what did they do right? What are they doing right?

When I ask this question, the first reaction I get is you cannot trust Chinese data. Maybe. But you certainly can trust their actions more. If many infected people were flooding their hospitals, the country would be in lockdown. They did it before the rest of us even understood what the word meant. I also get answers which are conspiracy theory like and at least for the purposes of this project, I am not interested in them.

From the few non conspiracy theory responses, what I can make out is following

  1. Masks are compulsory.
  2. Mobiles are key — your status Green, Red and Orange determines what you and your family members can do and where they can go.
  3. From very early on they made sure that you were separated from the society including your family at the earliest sign of infection. This is because the overwhelming mode of infection is within families.

This is of course very thin (and probably at least slightly wrong). So, I am trying to get more information from my connections. Getting answers to questions like, what is day to day life like? If it is near normal, since when? What are the Covid related restrictions? What does social distancing actually mean practically? What is the Standard Operating Procedure (SOP) in case you get any Covid like symptoms or if you fall sick?

Do reach out to your friends in China if you can, and talk to them and share your learnings here!

0

Unlocking the economy : the road aheadfeatured

April 16, 2020

Delicate balance, considerations and decisions

(Manish Agarwal (Infrastructure specialist &AskHow volunteer) and Sanjay Srivastava (Integrated industrial ecosystem professional) ask, How would the lockdown be released, with a follow-up on the previous Article published on Apr 12, 2020. This is an indicative framework, intended to provide structure to a crucial dialogue. All views are personal).

The unlocking of economy is complicated by the need to contain the pandemic. The size and diversity of India only increases this complexity. The balance between the two will remain in a state of “dynamic equilibrium”, requiring constant corrections, to stay the course. We expect to hear debate on whether the Government is permitting “too little” or “too much”, over the next few weeks, until (hopefully!) we accept some state as Goldilocks’ “just right” one.

The Ministry of Home Affairs (MHA) has issued a guideline on April 15,2020 listing certain economic activities & opening conditions permitted after April 20, 2020. We had presented a framework of choices in the first article. We use the same to highlight the challenges that will be faced, and key considerations in resolving them.

  1. Where ? The MHA order allows select additional activities in areas not demarcated as containment zones by States/ UTs/ District Administrations. The order broadly envisages three areas. (1) the hotspots, where nothing will be permitted; (2) rural areas and industrial parks, where most activities are permitted; and (3) rest of India (largely, urban) where restricted economic activities are allowed. The States and UTs are tasked with identifying and managing permissible zones and containment zones. This broad-brush categorization is useful as a first step, considering that we have still not crossed the peak of new infections discovered. However, with well over 60% of GDP being generated in urban India, there will be a clamour for more granular categorization, and creation of sub-clusters that can be opened. Factors that consider medical readiness and economic impact, backed up with dynamic reassessment, will be key to the difficult decisions that will follow.
  2. What (and in what sequence)? The emphasis remains on expanded definition of “essential services”. It covers most of the primary sector (agriculture, fishing, poultry, etc.), parts of industry (pharma, medical equipment, continuous process and IT hardware), and some services (public utilities, financial sector, IT/ITES (with 50% attendance), plumbers/electricians, etc.
    Construction is permitted in non-urban areas, (except where workers are already in place). Retail is opened up for supply of essential services, without direct traffic at the stores. Though e-commerce companies have been permitted to supply essential services, their ability to home-serve large parts of urban India in a cost effective manner, will be tested. Perhaps, the ability to provide larger parcels (e.g. if non-essentials are also permitted), may be needed. Each of these two sectors contribute to over 8% of the economy, and are not easily amenable to social-distancing. It is likely that these sectors become more prominent as the debate on implementation issues grows. The industrial sector has been largely permitted to start work, as most of them are in non-urban areas anyway. Whether the capacity utilisation restrictions (for social distancing) becomes a constraint will be known only as the demand becomes more visible, which is likely to take over a month, as inventories get pushed out first. A huge responsibility has been placed on Industrial Park operators in permitting them to operate. Their continued operations will depend on their ability to implement sanitisation processes and align with the Government for quick identification & isolation if the situation arises.
  3. How? We had highlighted the need for “sanitised operations guidelines” in our first article as a critical success factor. Annexure I of MHA guidelines defines enforceable directives for public spaces, work spaces and manufacturing establishments. Further, Annexure II delineates Social Distancing norms to be followed for all establishments planning phased opening. While these initial guidelines are certainly a good start, we do expect these to continue to evolve as various businesses put them into practice. The challenge of minimising risk of transmitting infections, within reasonable cost, will lead to ethical dilemmas. Any approach which requires “elimination of risk of infection” is likely to be impractical. Rapid buildup of health infrastructure, and building confidence in it, is the necessary step to managing this trade off sensibly.
  4. Transport & Logistics. A big thumbs up to the guidelines for having covered the backward and forward linkages of each permitted activity with sufficient emphasis (e.g ambulance manufacturing, service providers to hospitals, etc are permitted). This will ensure that subsequent decisions / clarifications are not needed, as these activities get started. The same has also been done with Goods transport, which is permitted, and truck repair services, dhabas etc. are also permitted. All passenger transport (road, rail, air, taxi, private) continue to remain suspended (except where required for permitted activities). Opening of passenger transport will be a key challenge for the subsequent phase, particularly in low-impact areas, and will lead to debates on what boundaries can/ how to be permitted to be crossed. Without this, most of urban India will see little change in their lives after May 3.
  5. Governance. The governance system empowers District Magistrates who in turn can deploy Executive Magistrates as Incidence Commanders to enforce the rules and restrictions; and punishment & penalties are spelt out. State Governments are permitted to have more stringent rules than in the guidelines. The coordination mechanism between Center, State and local administration has hopefully been set up by now. It is inevitable that clarifications and calls for leniency will arise as the implementation gets going. A robust mechanism would be required for quick two-way exchange/ feeding of these into the Center’s & states’ control room, and equally quick dissemination of the answer to all State and local area implementers. As case by case issues arise, the robustness of the governance mechanism will get tested.
  6. Communication and Course Correction. The MHA guideline is a good example of communication in time (atleast 5 days ahead) and with reasonable clarity. The same approach would be helpful as further categorisation and unlocking gets decided. The possibility of rollbacks (say, from Green to Yellow etc.) should be part of such communication. People will also want to know the criteria for an area to stop being a hotspot, and thereby becoming eligible for permitted activities. Another challenge would be to communicate to workers that it is reasonably safe to come back to work, by building confidence in the SOPs and medical infrastructure. This would also require a differentiated approach where parts of the workforce will have to be paid to come to work, while others are paid to stay at home.

India is observing a 40 day “quarantine” period, fully justifying the term. However, there is a long way ahead, described by Tomas Pueyo as the “Hammer & Dance” strategy. The extent of impact of the hammer will be better known as we get closer to the May 3 deadline, and the question of “what next & how” becomes prominent.

In conclusion, the first steps towards unlocking will certainly have implementation challenges and difficult tradeoffs. The manner of handling these will provide the confidence for people to continue to align with the post May 3 rules. As everyone looks forward to a possible stimulus package in offing, further steps on the unlocking, its management & governance, and communication, remain critical to achieving the balance between managing the spread and growing the economy.

#StaySafe #StayHome #IndiaFightsCorona

https://www.linkedin.com/in/sanjays
https://www.linkedin.com/in/manish-agarwal-0985774

0

Framework for unlocking the economy: Scenarios and Choicesfeatured

April 12, 2020

(Manish Agarwal (Infrastructure specialist &AskHow volunteer) and Sanjay Srivastava (Integrated industrial ecosystem professional) ask, How would the lockdown be released? This is an indicative framework, intended to provide structure to a crucial dialogue. All views are personal).

Why do we need an unlocking framework:

  1. There is general appreciation that lockdown was an unanticipated necessity, with the singular objective of containing the spread (even though the Disaster Management Act 2005, required preparation for such scenarios, but more on that at the right time). The unwinding of the lockdown will be more complex, with multiple conflicting objectives, in an uncertain environment. The race to achieve medical readiness in each district, will have to be run in parallel with continuing production and supply of essentials. The list of essentials will expand over time, to both, service demand and maintain livelihoods. Large parts of the population do not have deep savings to survive an extended period of inactivity. Even with Central & State Govts DBTs (which is also limited), it is quite likely that people will begin to violate the curfews. The time to develop the blueprint for unlocking is now; not least because several stakeholders will need to be consulted and onboarded to the unlocking plan.
  2. While we have proposed several dimensions of the “unlocking framework”, we recognise that this is neither complete in coverage, nor has sufficient depth. The intention is to start a discussion, so that the most important issues, and their interdependence, is better understood. We are convinced that a simple approach of opening up the unaffected districts will not have an impact on the manufacturing sector, for instance, considering the widespread domestic supply chain.
    What are the elements of an unlocking framework ?
  3. Where? Two tests should inform the decision on where to start unlocking. (I) Medical readiness – i.e extent of impact, rate of growth, depth of medical facilities and ability to ramp up medical support. (II) Criticality to the domestic supply chain – i.e role in providing labor, raw material, production or market for key goods and services. The “per capita infections” measure is misleading, and not helpful, at the country level. We need to look at this at State level, and at district level, considering our size. This could also provide the decision-structure for unlocking more areas as they achieve the desired parameters (and, to roll back, if the situation deteriorates). The Domestic Supply Chain will need to get re-aligned, and there will be difficult political implications. It is critical that there is an objective, independent approach that can minimise politicisation of this process.
  4. Who (or in what sequence)? The first priority has to be to ensure that the production and supply of essential services gets reinstated, lest we consume away the reserves. The next question, as to what is “semi-essential” and what is “discretionary” is more challenging. It is perhaps easy to agree that businesses like entertainment, sports and tourism are discretionary, and could remain closed for longer, to avoid crowds. But what about manufacturing and sale of TVs and ACs ? And, manufacture of a component that goes into both, ACs and Medical equipment like ventilators ? A simplified approach will need to be quickly developed, to avoid protracted lobbying. A mechanism to support businesses that get classified as “discretionary” is equally critical for success.
  5. How? To achieve a balance between minimising spread of infection and enabling economic activity to commence, there will be a need for “Sanitised Workplace Guidelines” for different business environments. Construction sites (including NREGA sites) would perhaps be a useful place to start, considering the employment potential, and the ability of the Govt to put money into the economy (besides the benefits of completing infra projects). The Guidelines would need to address not only the site operations, but also transport and living conditions of the workers.
  6. The Transport & Logistics industry is uniquely critical to the problem and the solution. It was shut down to stop the spread; and the revival cannot take place without opening it up. As the Domestic Supply Chain gets realigned, it would be important to open up the Logistics sector at least 3-5 days ahead of the others. In absence of this, there is likely to be much chaos as trucks may not be available to connect to rail, workers may not be able to reach workplaces, ports may not be ready, etc. This is critical for factories that have ready finished goods, which can be quickly got to the market; particularly for exporters who can fulfil their orders, or want to grab the opportunity available in global / regional supply chain realignment.
  7. The governance system for managing such a plan, which will need to remain dynamic to adapt to evolving situations on the medical front, will need to be innovatively designed. This will need to be a cooperative approach as a combination of a top down directive, supported by state, district and city administrations. Local administration would need to be given the flexibility to act within broad guidelines. Indeed, several of them are doing that at present, leveraging private sector and civil society. Industry associations will need to play a very mature role, going well beyond lobbying from a short term perspective alone. Technology will be key to decision making, monitoring and sharing (again, several administrations have demonstrated a high level of readiness to do this, in managing the current and earlier crises). The State and Central Govts will need to have multi-competency task-forces, which can help to quickly weigh trade-offs between medical and economic risks, which will invariably arise.
  8. Need for measures to support impacted people and businesses, through this revival process. Some steps have already been taken for both, and others are likely to follow. Encouraging consumption will not only require putting money in the hands of the most needy, but also to provide consistent and transparent communication in the near future. Businesses will need to be given flexibility to share the pain with their employees, particularly those who are being supported by the Govt. The guidance to businesses to continue paying salaries is not sustainable. This holds true for the Govt also. While the fiscal limits will certainly be breached, it is necessary that the Govt conserves its fiscal powder, considering the uncertainty of the time and extent of the medical emergency.
  9. Accelerate priority opportunities. Initiatives that will yield results in the medium term will need to proceed in parallel with the above immediate steps. Some of these were anyway on the agenda for accelerating economic growth. Prioritising construction of infra that will have quicker impact on the economy and on job creation, continues to be necessary. More approvals may need to be put on self-certification, at least for the interim; shortening the project preparation time has always been a need, which is further underlined in the current context. The Govt will need to work with State Industrial Development Corporations and Private Industrial Parks to prioritise industrial investments that can be fast tracked. This constituency will be critical to the ambition of positioning India as a leading alternative in “China+1” Strategy for global and regional value chains of global manufacturing layers, in due course.
  10. Communication and Course Correction. Through the two week lockdown period, communication from the Govt has increased, but much more will be needed as we enter the more complex phase. In addition to sharing progress, proactive communication of future measures will help administration and citizens in suitable planning & execution. This will reduce any conjecture and rumours. It is important that key stakeholders, particularly the media, recognise that the leaders are taking decisions in the face of uncertainty, while the commentators have the benefit of hindsight. In fighting an evolving pandemic situation, it is inevitable that decisions have to be revised based on developments. Regular transparent communication will be critical to appreciation of the decisions and course corrections, as the unlocking gets planned and implemented.
  11. In conclusion, we believe that a multi-dimensional plan is necessary for this unprecedented challenge encompassing business, human & life variables. It is also a unique opportunity, as large demand centers and production centers of the world continue to be locked down. We believe parallel progress along the following tracks is required:
  • A calibrated unlocking, recognising the regional inter-dependencies, along with safety & sensitivity
  • Supporting workers, but also businesses, in reviving demand where possible, and easing the pain where it is not
  • Synergising the enthusiasm and energy of private sector, civil society and individuals who are keen to participate in the disaster management process.

If we do this well, India emerges as a considerate country for its citizens and stronger economic powerhouse apropos its stature & potential.

#StaySafe #StayHome #IndiaFightsCorona
(With inputs from Sandeep Achantani, Biju Potty, Anirudh Dange, Pramad Jandhyala and Yogesh Upadhyaya, who are all professionals, running businesses for over 25 years).
https://www.linkedin.com/in/sanjays
https://www.linkedin.com/in/manish-agarwal-0985774

0

What would you do?featured

April 10, 2020


My WhatsApp and Facebook feeds have seen an sharp increase in posts and comments criticizing governments for their action against the spread of Covid — 19. This criticism is not just in India, but in a wide variety of countries like the UK, US, and Philippines. I believe that we should be rationing our criticism as carefully as many of our fellow citizens are rationing food and Toilet Paper. I explain why.

Picture Credit : Pixabay

Decision making in face of Covid -19 is tough and the first challenge that the disease has posed leaders across the world is that we don’t know enough about it.

Leaders are working with imperfect information

Everything we know about Covid -19 is tentative. Take for example the question — How infectious would it be in India? There are estimates based on how fast it spread in China and Italy. But a leader in India cannot take those estimates as given. The infectiousness may decrease with heat and humidity. It may also be lower than it is in Italy as our population is relatively younger. But, our density of population is very high and as stories such as that of Tablighi Jamaat have shown, we may not be able to persuade people to practice social distancing very strictly.

You can get expert opinion but experts contradict each other. They even contradict themselves over a very short period of time. Remember that as late as mid-January, the World Health Organization (WHO) was telling all of us that COVID -19 did not have human to human transmission. Or note that Center or Diseases Control (CDC) in US has been telling its citizens that masks are not useful for them. CDC will change its mind soon.

Take another issue, the issue of migrants. Do we know how many economic migrants are there in the country? Not really. The Economic Survey made estimates and they ranged from 50 to 100 Million as I have discussed here. We have all seen stories of migrants fleeing in buses and even on foot but does anyone know what percentage of the migrants actually decided to go? Of course not. Nobody knows and it is unknowable.

Do note that I am not suggesting that all experts are wrong. Some of them may eventually turn out to be right but we have no sure way of knowing who those are right now [1].

Unfortunately, lack of information is not the only problem. Perhaps a bigger problem is that every action, including inaction has negative consequences.

You are not choosing between a good and bad alternative but between two bad alternatives

When should the Indian government have imposed the lockdown? There is no right answer for this question. If you leave it too late, a very large number of people could be infected and would in turn infect others. If you do it too early, then it is likely that many citizens would be unprepared for it. Also, if you do it too early, it is likely that people do not take it seriously because they have not seen or heard of people in their neighborhoods get infected and die. This is true nearly all over the world. People in Italy did not learn from China and people in US did not learn from Italy. We can be sure that residents of Maharashtra will not learn from US and nor will Biharis learn from Maharashtrians.

Let us look at the issue of migrants again. Any lockdown policy for migrants has negative consequences. Should the government somehow force / persuade a migrant to stay where he is? If yes, how do you convince him that if he does get diseased, he would not be the last in the queue for medical help? How does he make rent? How does he get food? What does he do to persuade his fearful landlord to not chuck him out?

If you somehow transport migrants back to their villages then you have a different set of problems / risks. What if they carry the infection back to their homes — places which are woefully short of health care infrastructure. Would their fellow villagers allow them to come back? What happens to the critical manufacturing that the migrants may be engaged in? Would this exodus mean that we run out of critical goods and services immediately or at best in a few weeks?

The problems of choosing between two bad alternatives is made worse because of the size and complexity of the country.

India is large and complex

The country has twenty eights states. Many of them are larger than prominent nations. Uttar Pradesh, our most populous state, has nearly as many people as Brazil! The country all together has 6,00,000 villages and more than 4,000 towns. This means that all decisions are being implemented one or more of the central government, the state government and the relevant local body. Most of the rural local bodies are powerless and understaffed. Many of the urban local bodies are also understaffed too. The municipalities of a town of one hundred thousand people could have only a score of employees and may be in no position to execute decisions.

But if you are a decision maker, this is the machinery you have. It is what it is.

The decision makers are working in a large, complex country on a problem where the data is inadequate as well as contradictory and every action has a negative consequence. Does it mean that they should get a free pass as far as criticism in concerned? No. Criticism has huge benefits.

Criticism is very necessary

Focused criticism can make the government act. If there are pockets or even large areas where people are undergoing extraordinary difficulties, criticism will help force the governments to assist them. The focus of media on the plight of migrants probably helped all the relevant governments to take steps to help them reach home.

Second, a lot of money is being pumped into the economy by the government. As sure as night follows day, there will be corruption. It may be blatant corruption for example, in buying medical supplies. Or it may be subtle, for example, in supporting businesses without imposing any costs on equity holders as Taleb as argued against. Criticism in such cases may hopefully limit this corruption a little.

Third, the crisis will encourage governments to curtail the freedom of citizens and many times it would be a sensible move. The challenge is that governments tend not to let the citizens get their freedoms back easily. Civil society that watches the government like a hawk would be essential in getting the freedoms back.

So what do we do?

If you are criticizing government actions all the time, while not acknowledging the complexity of the situation, the chances are that nobody is listening to you outside your bubble. Just like nobody reads the posts of hard-core supporters of governments outside their bubble. Your criticism needs to be rationed and nuanced to be credible.

How could you make Credible Criticism? I would suggest the following format.

“I understand why the government has taken the step XYZ.

I understand that not taking this action had the following consequences OR I understand that these were the possible benefits of the action.

a)

b)

c)

But, I would have taken an alternate action ABC and would have lived with the following consequences of my actions.”

I)

II)

III)

Of course, the actions you suggest should not be adverbs. So you should not say that I would have taken the same steps but executed them more efficiently or more compassionately! That is neither here nor there.

Such a criticism would force you to study the complexity and automatically reduce the frequency of your posts. It will hopefully also make you Steelman instead of Strawman the actions that you are criticizing. That would make your criticisms more credible and credible criticism is something we need.


Post Script

I believe that the following three categories should be exempt from the requirement of Credible Criticism

· I need love: It is possible that your social media posts are just your way of handling the stress of the situation. Your posts are saying just saying, “OMG, I am freaking out!” and that is OK.

· Holy warriors: It is also possible that you feel that the only thing that really matters is who wins the next elections in your country / state. In that case too, you can ignore what I have written.

· Comedians: If you are a professional or an aspiring comedian, you have to keep posting and you probably do not have the time to dive into any kind of complexity.


[1] I first saw this framing in a tweet from Scott Adams.

Related content: How many people migrate in India for economic reasons? I have written about it here.

___________

Author –

Yogesh Upadhyaya

(Yogesh Upadhyaya is one of the founders of AskHow India. Blogs are personal views.)

You can follow AskHow India (@AskHowIndia) or me (@Uppi89) on twitter or me on LinkedIn


0

Is Haryana becoming Kerala?featured

March 26, 2020

This is the eighth post in a series on population in India. Each post can be read independently. The links for the first seven posts are at the bottom of this one.

Ms. Smriti Irani recently claimed that India has improved its Sex Ratio at Birth (SRB) from 918 in 2014-15 to 931 in 2018-19. Haryana, which has had the worst SRB, made striking improvements. This report suggests that the SRB in the state had gone up from low 800s to 923 in 2019! In other words, in 2019 there were 923 girl child births in Haryana, for every 1,000 boy child births. These improvements, if true, are astonishingly positive. The big question is, if the improvements are indeed true. Is Haryana becoming like Kerala, a state which has always had a high SRB? I try to answer this question in this post.

For representational purposes only. Picture credit: Pixabay

The basics

India discriminates against women as I stated in my last post. The Population Sex Ratio (PSR) in the country, or the ratio of females to males, has been lower than the world average for at least the last 70 years. In the first few decades after independence it was due to excess female mortality, especially in the very young. Since 1980’s, Sex Selective Abortion has started taking over as the main cause of low PSR.

There is a wide difference in Sex Ratio at Birth (SRB) across states of India. NITI Ayog reported that in 2014- 2016, SRB in Haryana was 832 whereas it was 959 in Kerala. It is generally agreed that if there is no sex selective abortion, the SRB would be between 942 and 953. The following table gives the ratio in the for a few of the larger states.

As can be seen, the Southern and Eastern states have a much better SRB as compared to the Northern and Western states. Although, the Southern states are economically better off than average, prosperity itself is no determinant of low SRB. The Northern states of Punjab and Haryana are relatively prosperous but have SRBs which are lower than national average. Haryana being the worst in the country.

As I discussed, low SRBs in a society are a function of strong preference for sons accompanied by prosperity that allows for spread of technologies for sex determination of foetus and abortion. There is strong preference for sons in many Indian states. It is specially so in Haryana.

Preference for sons

The preference for sons in a society can be exercised in one of two ways. The first way is use of contraception. A couple may decide to have a target number of children as long as at least one of them is a son. The couple would use contraception once they have the target number of kids, if at least one of them is male. Let us illustrate the arithmetic behind contraception method with an example.

Suppose there are a 1,024 couples who target to have 2 kids as long as at least one of them is male. That is, if they have at least one male child in the two, they would start using contraception. If both their first two kids are female, they would have one more kid and stop if the third kid is male. If the third kid is female, they would have one more kid. The couple stops having kids after the 4th and uses contraception regardless of whether the fourth kid is male or female. The following image details the outcome.

Note, for the sake of simplicity, I have assumed that it is equally likely that the couple have a male or a female child although the probability of bearing a male child is marginally higher.

As can be seen, contraception method does not change the SRB of a population. The method does make the last child much more likely to be male. This skews the Sex Ratio of Last Birth (SRLB).

In a paper published in 2013, John Bongart plotted the actual Sex Ratio at Birth and the SRLB of last birth for 29 Indian states. I have reproduced the image below

As can be seen, the SLRB is low (high in chart) for the states of North and West with the lowest in Haryana (highest in chart). The data in this chart is from 2004-05 but as the SRB in Haryana was 832 even in 2014-16, it is clear that the culture hadn’t changed till then.

The second method used by couples to exercise their son preference is to determine the sex of their foetus and abort it if it is female. This Sex Selective Abortion is more common in societies with low fertility – China being a prime example. Internationally, only South Korea has been able to reverse a fall in SRB caused by Sex Selective Abortion.

So did Haryana with its preference for sons, really manage to correct its SRB so sharply post 2014-16? To take another step in answering this question we should look at data sources.

The data muddle

The NITI Ayog relied on Sample Registration System (SRS) in its report quoted earlier. Unfortunately, I haven’t been able to locate any SRS reports post 2016 that give out state wise SRB. So what has the government relied on when it has talked about the improvements in SRS?

According to this report, MS. Smriti Irani was quoting the data compiled by the ministry which was drawn from the Health Management Information System (HMIS) updated by Anganwadi and Asha workers. This considers home deliveries and births in government institutions only. It lacks information from private hospitals and institutions.

Another source of data has been the Civil Registration System (CRS). The Indian Express report quoted earlier, relied on this. Unfortunately, I have no idea how reliable these two data sources are. The Express reports says that the SRB in 2014 for Haryana was 871 whereas it was 831 according to the NITI Ayog. So clearly, there is a discrepancy in CRS and SRS. Of course, it is possible that more recent SRS data may show the same positive trend even though there may be differences in the year by year figures.

Discussion

The government has claimed that SRB has increased very sharply for India and particularly for Haryana. If corroborated, this would be an astonishing achievement. However, the claims of the government depend on data sources which may not be reliable. In recent history, the only place to see a reversal of SRB declines is South Korea. In this context, the really sharp increases reported  could be too good to be true.

So am I saying that there is no progress in Haryana? Not really. All I am saying is that we should wait for more reliable data like the 2018-19 National Family Health Survey or even the census data. If these sources verify that there is progress, even if it is not to the extent claimed, then the country would have done very well. Till then, we can only be cautiously optimistic.

___________

Author –

Yogesh Upadhyaya

(Yogesh Upadhyaya is one of the founders of AskHow India. Blogs are personal views.)

You can follow AskHow India (@AskHowIndia) or me (@Uppi89) on twitter or me on LinkedIn

This is the eighth in a series on population. The first seven articles can be found here

  1. Everything you wanted to know about population (but were too lazy to Google).
  2. Are the Acche Din of population growth already here?
  3. Chhath — the new national festival?
  4. Economic migration in India — The Who, the Why and other good stuff.
  5. Islam and population growth in India.
  6. Migration and political demography in Assam
  7. Missing women in India.
0

Missing women in Indiafeatured

January 20, 2020

This is the seventh post in a series on population in India. Each post can be read independently. The links for the first six posts are at the bottom of this one.

There are fewer females in India as compared to the rest of the world. A brief discussion of the causes.

I started this series on population in India with some basics.  One of the charts in that piece was on the number of females per thousand males. The chart shows that this  number was lower in India than that for the entire world even in 1950. Moreover, It has also fallen continuously in  the last seventy years. When I looked at the chart, many questions popped in my mind and I have answered those questions in the post.

Why was the ratio low for India even in 1950s when technology for sex determination of foetuses not widely available and hence sex selective abortion not possible? Why did it fall further in subsequent decades? Why did the availability of new technology not lead to a sharper fall in this number? Why was the number low for the world as a whole and why did it fall further in the last 70 years?

Before we start answering these questions, let us go over some basics.

Basics of population sex ratio

The Population Sex Ratio (PSR) [1], or the ratio of females to males in the entire population, can be low due to two reasons

  • Post birth excess deaths: More females die in society because they are discriminated against. In more formal literature this is called postnatal excess deaths.
  • Pre Birth Sex Selection: The number of girl child births are less than ‘normal’ because parent find out the sex of their unborn child and decide to abort it if it female. This is also known as sex selective abortion. In more formal literature this is called prenatal sex selection.The ratio of girl child births to boy child births is called Sex Ratio at Birth (SRB). 

The pre-birth sex selection can also indirectly come about if couples use contraceptives in case they have male children but do not use them if they have no male child. I will cover this in more detail in a subsequent post.

How would we know if the PSR or SRB in a country is lower than normal? Researchers typically use comparisons. The PSR or SRB of a country like India is compared to that in other countries where the discrimination against women is lesser.

If there is no sex selective abortion, more male children are born than female children. Historically, this has been so across the world. The ‘natural’ sex ratio at birth is between 942 and 953 female births for every 1,000 male births. Any ratio lower than that and it is likely that there is sex selective abortion in that society. Technologies for  determination of sex of the foetus – such as ultrasound – started becoming widely available in mid 1980s. Since then, the SRB in India has fallen below 910.

Females live longer. That is, they live longer in societies where they get the same access to nutrition and health care as men. A comparison of ratio of Life Expectancy at birth for females and males, would tell us something about discrimination against women in a society. This ratio is called Sex Ratio Life Expectancy (SRLE).

It is generally accepted that in a society with very little or no discrimination, SRLE would be 1.06. The SRLE in India was low in the years after independence. In 1970, it was 0.98. However, by 2010, the SRLE had climbed up to 1.05. The low ratio in the early years was mainly due to high mortality in children below 5 and a very high gap between the mortality of the girl and the boy child. Thankfully, both the under 5 mortality and the gap have fallen in the country significantly.

One of the early prominent papers on PSR was from the noted economist Dr. Amartya Sen, in which he claimed that there were at least 100 Million fewer women in the world because of discrimination. In this paper, Dr. Sen compared the population ratios of countries like China and India with the West. This comparison was criticised as the population in the West is older and hence likelier to have more women than a population which is younger (To recap, younger populations have more males as more males are born naturally and older populations have more females because women live longer). Dr. Sen accepted this criticism and in another paper (1992), he compared the population of China and India with that of sub Sahran Africa. He again concluded that the number of missing women was more than 100 Million.

Over the years, many different estimates have been made. All of them agree that the number of women in the world would have been higher if there was less discrimination.  However, their estimates vary from 60-70 Million to much more than 100 Million.

In 2015, John Bongaarts  and Christophe Guilmoto wrote a paper on this subject. Their main observations are

  • Countries like China, India, Pakistan, Bangladesh and Vietnam are responsible for most of the missing women in the World. That is, they have a PSR lower than, not only the West, but also sub Saharan Africa.
  • China and India, due to their large population sizes, are the most significant contributors to the missing women.
  • The imapct of SRBs became significant from the mid 1980s. Before that it was post birth excess female deaths that were responsible for low PSR.

What are the factors that determine SRB?

Many societies have a preference for the male child. This preference could be because sons take the forward the last name of their parents (patrilineage), have greater earning potential, are expected to protect and provide for the parents (especially in old age), do not incur dowry costs and / or are needed for funeral rites[2].

This male preference may translate to excess deaths post birth but does not automatically lead to a lower SRB. There are two additional conditions

  • Prosperity – this allows technologies, such as those for sex determination of a foetus, to be widely available.
  • Low fertility – this is surprising at first glance but makes sense when you think about it. When a couple decides to have fewer kids and also has a strong preference for sons, it is more likely that they would opt for an abortion on the basis of the sex of the foetus. This is the reason, that the SRB is worst in China. The ‘one child policy’ of  the country has meant that there are less than 833 female births for every 1,000 male births in that country.

Incidentally, these factors also explain the wide variance in SRB across different states in India. Bongaart mentions that the SRB in Uttar Pradesh and Bihar is relatively high in spite of their sharing cultural norms with Haryana and this is probably because of the relative poverty and higher fertility of Uttar Pradesh and Bihar. Haryana has one of the lowest SRBs in India. I would be covering the interstate differences in SRB in a subsequent post.

With this background, it is time to answer the questions I raised at the beginning of this piece.

The questions answered

Why was the number low for India even in 1950s when technology for sex determination of foetuses not widely available and sex selective abortion not possible?

More females died prematurely in India than they would have in absence of discrimination. A significant number of these deaths were for ages 5 and below. Also, the Indian population was probably younger than the world in 1950s and as we have discussed, younger population would have fewer women. These two reasons contributed to the PSR of India being lower than that of the world.

Why did it fall further in subsequent decades?

I haven’t been able to answer this question definitely, but my guess is that in subsequent decades, although the mortality for children under 5 improved, it did so much faster for the male child.

Why did the availability of new technology not lead to a sharper fall in this number?

At least in the case of India, the high post birth deaths were nearly substituted by sex selective abortions. Do note that a  significant number of excess post birth female deaths were in very young girls (<5). This number has gone down even as the SRB has gone down.

Why was the number low for the world as a whole and why did it fall in the last 70 years?

Post birth discrimination was common in large parts of the world in 1950. Moreover, these were the more populous parts of the world. China, India, Pakistan, Bangladesh, Vietnam, and Indonesia are some of the countries that contributed to the low ratio. In the last 70 years, the population share of these countries rose and their PSR fell. This is the reason for low PSR for the world in 1950 and also the fall since then.

Short Answer: China and India.

___________

[1] Both Population Sex Ratio (PSR) and Sex Ratio at Birth (SRB) can be expressed as ratio of females to males or the other way around. Furthermore, some authors express the ratio in thousands and some in hundreds. I have defined the ratios as number of females per thousand males and have made conversions wherever applicable.

[2] This seems like a good place for my usual social media disclaimer – My writing is usually positive (i.e. a description of what is) and not normative (i.e. what should be).

___________

Author –

Yogesh Upadhyaya

(Yogesh Upadhyaya is one of the founders of AskHow India. Blogs are personal views.)

You can follow AskHow India (@AskHowIndia) or me (@Uppi89) on twitter or me on LinkedIn

This is the seventh in a series on population. The first six articles can be found here

  1. Everything you wanted to know about population (but were too lazy to Google).
  2. Are the Acche Din of population growth already here?
  3. Chhath — the new national festival?
  4. Economic migration in India — The Who, the Why and other good stuff.
  5. Islam and population growth in India.
  6. Migration and political demography in Assam


0

Migration and political demography in Assamfeatured

December 01, 2019

This is the sixth post in a series on population in India. Each post can be read independently. The links for the first five posts are at the bottom of this one.

In my last post in this series on population in India, I showed that although the natual growth rates of Muslim population is higher than that of non Muslim population, there is nothing inherent in Islam that should keep it so. However, natural growth rates are not the only way the shares of population change. Big shifts can happen because of migration. Nowhere is this clearer than in Assam. The state has seen political conflict between ‘outsiders’ and locals for a long time now and the conflict has a religious element to it. In this post, I give a very brief migration history of the state, present some key facts and estimates and end with a few observations[1].

These rapid demographic changes are the reason for the National Register of Citizens (NRC) exercise in Assam. However, I would not be diving deeper into NRC.

Very brief demographic history of Assam

Assam was ruled by the Ahom dynasty for at least 400 years before it was conquered by the British in 1826[2]. The first significant migration into Assam was in the middle of the 19th century. Tribals from Southern Bihar moved to Assam to work in the tea plantations as the local Assamese did not want to leave their own farm lands. Bengali Hindus also came in to take up administrative positions. The 1900s saw an influx of Bengali Muslims who cleared forest areas and lowlands of Brahmaputra for agriculture. This influx continued through till independence and after.

There was a steady inflow of Bengali Muslims from East Pakistan (now Bangladesh) in the first two decades of independence. There was also migration from other states in India to Assam. In 1971, when the Pakistan army launched a vicious campaign against Bangladeshi nationalists, many citizens fled the country and came to India. A significant portion came to Assam and it is not clear how many went back.

Between 1950 and 1970s, the Assamese middle class was actually focused on keeping the Bengali Hindus out of middle class jobs, especially those in administration. They also wanted to make sure that the Assamese culture, especially the language, had primacy in the state. Winning elections was essential for this. The Bengali Muslims electorally supported the Assamese middle class as they were more interested in agriculture.

In 1979, the electoral rolls were revised and there was a sharp increase in the number of voters. The number of registered voters grew from 6.3 Million in 1972 to 8.7 Million in 1979,  a 38% increase. This changed the attitude of Assamese Hindus towards Bengali Muslim migrants and led to widespread protests. The protests became violent. It is estimated that hundreds if not thousands of  people were massacred in one particularly violent episode known as the Nelli Massacre.

Measures were taken to check illegal immigration after that but they were not very effective. In 1983 a new law for Assam called the Illegal Migrants (Determination by Tribunals) Act was passed. This Act defined foreigners as those who settled in Assam after March 25, 1971, the day Pakistan began its crackdown on Bangladeshi separatists. However, not many people were identified as foreigners under this Act as the burden of proof to show that someone was an illegal migrant fell on the denouncer. The Act was struck down for being unconstitutional in 2005. The National Register of Citizens for Assam was first created in 1951 but was not updated till recently.

In summary, non Assamese started entering the state in large numbers more than a century ago. After independence, many people entered the state from Bangladesh / East Pakistan and from other states in India. People of Assamese origin have been in political conflict with ‘outsiders’ for decades and there have been various political alliances in the history of the state.

I should note here that most immigrants probably worked very hard. For example, migrants who cultivated land cleared forests and lowlands which were never farmed before and this wouldn’t have been easy. Over the last century and a half, the migrants have contributed a lot to the economy of the state and the country.

How many ‘outsiders’ are there in Assam?

If we take the history of last one and a half centuries of Assam, there would be three broad types of migrations to the state. The first is the migration that happened before Independence when there were no international borders between Assam and rest of India including East Pakistan / Bangladesh. The second type of migration would be from West Bengal, Bihar and other parts of India after independence and the third would be from East Pakistan (Bangladesh). The children of all these migrants would be Assamese born but of different ethnic origin. Inter ethnic marriages complicate this issue further. Additionally, certain tribes in the state have their own distinct identity.

Only the third type of migration, i.e. migration from East Pakistan (Bangladesh) after independence, is actually illegal. But, politically the number of all migrants and their descendants is significant. This is because in India many people vote on the basis of their religious, ethnic or caste identities.

So how can you know the percentage of ‘outsiders’ in the state? Two proxies for people of non Assamese origins are language (mother tongue) and religion. One confounding factor is that Bengali Muslims used to mention Assamese as their mother tongue in surveys. This was especially true in the early decades after independence as Bengali Muslims and Assamese middle class were in a political alliance. In any case, the actual mother tongue of many children of migrants would be Assamese. The other confounding factor is that although it is likely that Muslim migrants were from East Pakistan / Bangladesh, it is not certain. They could be from Bihar or from other parts of India.

Given this background, it is natural that all estimates of ‘outsiders’ are vigorously contested. The typical technique is to compare the actual population (as counted in census) with what the population would have been on the basis of normal growth rates.

Myron Weiner compared the growth rates in Assam and rest of India for the first eight decades of the twentieth century.

As can be seen, the decadal population growth rates in the state have been much higher than that in the rest of the country. This suggests that the state has a very high proportion of migrants. According to Weiner, had the growth rate in Assam been the same as that in Rest of India, the population of the state would have been 9.5 Million rather than 19.9 Million in 1981. Even in the 9.5 Million population many would have descendants of migrants.

The share of Muslim population in Assam has steadily increased from 24% in 1971 to 34% in 2011[3]. Dr. Nandita Saikia of Jawaharlal Nehru University and of Professor Abdul Manan former professor of statistics at Gauhati University have very different explanations for the same.

Dr. Saikia asserts that significant migration has happened into Assam and it has been mainly from Bangladesh. Her calculations show that between 1951 and 2001, the number of migrants from East Pakistan (Bangladesh) and their descendants is 4.2 Million and 90% of them are of East Pakistan / Bangladeshi origin. These migrants since Independence formed nearly 16% of the population of the state in 2001.

Professor Mannan believes that the increase in share of Muslims in the Assamese populaiton is almost entirely due to higher fertility of Muslim women and due to the prevelance of child marriage in the community. Furthermore, he argues that the availability of land has been very limited in Assam for decades now and it does not make sense for Bangladeshis to come to Assam anymore.

I should note here these estimates of outsiders including those for illegal immigrants are only of the gross number of immigrants. It does not actually identify the individual outsiders.

Summary and Observations

  • Assam has seen a very sharp increase in the proportion of non native Assamese over the last century or so.
  • People vote based on their identities – these could be cast, religion or ethnic origin. When shares of population change very quickly, it is understandable that the local population gets anxious.
  • It is very difficult to identify illegal immigrants in Assam. People of non Assamese origin could be from the rest of India or could be descendants of people who migrated a long time ago. There are estimates of number of outsiders but these estimates are vigorously contested.

In summary, on the one hand there are anxieties of people of Assamese origin who are no longer a majority in the state. On the other hand are migrants who probably worked hard to make the state their home. Additionally, it is very difficult to figure out if they are there legally or illegally. So what do we do?

I don’t know. Balancing legitimate yet competing concerns is the main job of politicians. Not mine.

Author –

Yogesh Upadhyaya

(Yogesh Upadhyaya is one of the founders of AskHow India. Blogs are personal views.)

You can follow AskHow India (@AskHowIndia) or me (@Uppi89) on twitter or me on LinkedIn

This is the sixth in a series on population. The first five articles can be found here

  1. Everything you wanted to know about population (but were too lazy to Google).
  2. Are the Acche Din of population growth already here?
  3. Chhath — the new national festival?
  4. Economic migration in India — The Who, the Why and other good stuff.
  5. Islam and population growth in India.

[1] It is very ambitious of me to present the complex history of the state in a small blog post. I am sure I will make mistakes. Moreover, this topic is so politicised that difference of opinions are guaranteed. Feel free to comment and point out my mistakes as well as present alternate points of view.

[2] My understanding of the history of the state are from two sources. The book India Moving and The article ‘Political Demography of Assam’s Anti Immigrant Movement’ by Myron Weiner. As is normal, mistakes in understanding are mine. Please go to the original sources to see what those authors actually wrote.

[3] India Moving


0

Islam and population growth in Indiafeatured

October 18, 2019

This is the fifth post in a series on population in India. The first four posts can be found here, here, here and here. Each post can be read independently.

Recently, a Bhartiya Janta Party leader asked Hindu women to have more children. Possibly, he was trying to exploit a sense of unease that many non Muslims feel about growth of Muslim populaiton in India. I have sensed this unease in many people in casual discussions[1]. In this post I want to tackle questions on Islam and population growth in the country.

The basics

Is the share of Muslim population in India increasing?[2] Yes, as can be seen from the chart.

Of course, if you look at the actual population of Hindus and Muslims since independence, you see that both have increased significantly.

As I have written in the first post in this series, the last 70 years have seen the whole world population explode and that India saw a growth higher than world average. The good news is the fertility has fallen in India as well as in the whole world. The latest estimates show that the fertility rates in India are nearly at replacement levels ( although the population is projected to grow till 2065 as I have explained here). How have been the growth rates for Hindu and Muslim populations? The following table details the decadal growth rates

As can be seen,

  • The growth rates have fallen for both communities.
  • The decadal growth rate is higher for Muslims as compared to Hindus.

Do Islamic societies always have a high population growth?

Is there anything intrinsic to Islamic societies that keeps their population growth rates at high levels? To answer this question, I looked at fertility rates of some countries that have a predominantly Muslim population[3].

Many Islamic countries do have a high fertility rate. According to the World Bank, in 2017,  the fertility rate in Pakistan was 3.6 and in Afghanistan 4.6! However, equally importantly, there are many Muslim majority countries with a low fertility rate. For example, the Islamic Republic of Iran had a fertility rate of 2.1 as did Bangladesh. Interestingly all these countries had a fertility rate in excess of 6 in the 1960s.

Within India too, Jammu and Kashmir had a total fertility rate of 1.6 as per the latest Sample Survey. It may be remembered that approximately two thirds of the state’s population is Muslim.

So, clearly the religion of Islam is nowhere near being the primary driver of population growth rate. What are the main drivers then?

What does fertility depend on?

Hans Rosling – in this video – explains that the fertility rate in a society depends primarily on childhood mortality. Parents decide to have more children if there is a danger that many of their kids would die in childbirth or at a young age. Big reductions in fertility happen when very few young children die.

Other factors also help in reduction of fertility rates. For example, urbanisation, female education and empowerment and easy access to methods of contraception. And these factors are likely to be correlated. A relatively prosperous society is likely to be urban and to have medical facilities that reduce infant mortality. The women in such a society are more likely to be educated and empowered and it is also likely that contraception methods are more easily available.

So any Indians worried about high growth rate of Muslims in India should be thinking of same solutions as they would for high growth rates in non Muslim population. That is, reduction in childhood mortality, prosperity, availability of contraception and women’s education and empowerment.

Are there reasons that slow down the reduction in fertility? Researchers have argued that religiosity is one of them. That is, “women who report that religion is “very important” in their everyday life have both higher fertility and higher intended fertility than those saying religion is “somewhat important” or “not important.” Do note that high religiosity of women in all religions leads to higher fertility according to these studies.

Does this contradict my previous assertion that the predominant religion in a society has nothing to do with big reductions in fertility? Not really. What I am saying is that large reductions in fertility happen when society reduces infant mortality, empowers women and makes contraception easily available. However, after such big reductions have taken place, research indicates that religiosity of a woman predicts her fertility.

Summary

  • The share of Muslim populaiton in India has grown.
  • However, it is in the context of sharp growth of population of all religions.
  • High growth rate is not intrinsic to Islamic societies as cross country experience shows. As does the experience of Jammu and Kashmir in India.
  • Sharp fall in fertility happens with reduction in childhood mortality. Other factors are prosperity, urbanization, women’s education and availability of methods of contraception. Religiosity could contribute to a higher growth rate.

So, with low level of population growth as a goal for our country, we should be focusing on reducing childhood mortality and increasing urbanization, women’s empowerment and easing availability of methods of contraception for everyone.

________________________________________________________________________________

This is the fifth in a series on population. The first four articles can be found here

  1. Everything you wanted to know about population (but were too lazy to Google).
  2. Are the Acche Din of population growth already here?
  3. Chhath — the new national festival?
  4. Economic migration in India – The Who, the Why and other good stuff.

Author –

Yogesh Upadhyaya

(Yogesh Upadhyaya is one of the founders of AskHow India. Blogs are personal views.)

You can follow AskHow India (@AskHowIndia) or me (@Uppi89) on twitter or me on LinkedIn


[1] This post, and other posts in this series are written from a positive (what is) and not a normative (what should be) point of view. So I would not judge the apprehension people have of possible domination of Islam and merely enquire about what is the real situation. The only normative assumption is that in general, a low population growth rate is good for society.

[2] The data for the first section is from this post is from Wikipedia (https://en.wikipedia.org/wiki/Demographics_of_India, October 9, 2019). Calculations and charts are mine.

[3] DIfferences in fertility (and consequent differences in growth rates) are not the only way the population shares of religion changes. Immigration is another. Professor Chinmay Tumbe, in his book India Moving, has said that India was a net immigrant in the years 1970-2011. A very high number of these immigrants would have been from Bangladesh to the neighbouring states of Assam and West Bengal. This immigration would also have changed the religious demography of the two states and has definitely impacted the politics. I will tackle this subject in a separate post.


0

Economic Migration in India – The who, the why and other good stufffeatured

October 09, 2019

How many people in India migrate in search of work? Who are they? Where do they come from and where do they go? In my last blog in this series on population in India, I looked at the difference in fertility rates across states, and made the easy prediction that migration for work from North and East to the West and South is likely to continue for decades. I have done a deeper dive into this topic in this post.

Two sources helped me considerably. They are the Economic Survey of India, 2016-17 which has a chapter on economic migration and the book India Moving, by Chinmay Tumbe.

How many move?

The 2011 census estimated the total number of migrants due to economic reasons to be 51 Million. This is believed to be an underestimate. One reason is definition. Earlier official surveys defined people as migrants only if they were outside their usual residence for more than six months. As a lot of of economic migration is circular – that is is people move for employment for a short period and then return home –  official surveys did not count such migrants fully.  Many others are omitted because their residential sites are not enumerated in the destination regions. Others may self identify themselves as non migrants rather than returning migrants in the source region. Furthermore, women marrying economic migrants and then moving may state marriage as their reason for moving rather than employment.

The economic survey itself made two estimates. The first method was Cohort- based Migration Metric (CMM). In this method, the 10-19 year-old cohort in an initial census period and the 20-29 year- old cohort in the same area a decade later were compared after correcting for mortality effects. The difference was then scaled up to arrive at the figure for all age groups. According to this method, the annual inter-state labour mobility averaged 5-6 million people between 2001 and 2011, yielding an inter-state migrant population of about 60 million and an inter-district migration as high as 80 million.

In the second method, the researchers obtained the number of unreserved tickets between every pair of stations from Indian Railways. The net annual flows of unreserved passenger travel was used as a proxy for work-related migrant flow. This method estimated an annual flow of around 9 Million between states, nearly double the estimate of CMM method.

Of course, it should be remembered that a lot of migration is from villages to a city in the same district, which would only add to the above figures of economic migrants. Also, even these methods do not fully take into account the circulating nature of migration. A villager in Uttar Pradesh may work in Surat for four months as a contract worker and then go back to the village for the remaining part of the year. His job may be taken over by another migrant and these methods would count only one of them. Finally, many regions act as both source and destination for migration. For example, Professor Tumbe believes that there are 2 Million North Indians in Kerala and at the same time many people migrate from Kerala to other parts of India and abroad in search of employment. Another example is Goa, where migrants can be seen working in many tourism related jobs while local born have been migrating out for decades. The CMM method especially, would net off these migrations.

Given all these challenges, estimates of number of economic migrants varies quite a bit. Different research papers have estimated the share of economic migrants between 17% and 29% of our workforce. Even at 20%, the absolute number comes around 100 Million!

Where do they come from?

One of the startling insights of the book, India Moving, is that there are regions in India that have been sources of outmigration for more than a century. They are the coastal regions, especially the West coast, the Bhojpuri speaking regions of Uttar Pradesh and Bihar, and other regions like Punjab and parts of Chhattisgarh and Odisha. etc. The migration from these places has been to parts of India as well as overseas.

High population densities and relatively low prosperity may be the trigger for the initial migration but other factors become important with time. These are access to migration routes and to pre existing migration networks and a culture that looks up to outmigration. From India moving,

“On many indicators, Bihar fares worse than sub Saharan Africa whereas Kerala mirrors countries in Europe. And yet, both states experience similar rates of outmigration, defying simplistic assumptions that poverty is the main driver of migration, especially from rural to urban areas. What unites Bihar and Kerala is an extremely high rate of rural population density that simply cannot support enough livelihood in agriculture sector.”

And further on

“But as a general pattern, regions with high population densities, often sustained by easy access to water and pre existing migratory networks either through military service or global trade, were crucial factors in determining why some regions were more likely to participate in the wave than others.”

Who moves?

An overwhelming proportion of economic migrants is male. The survey states that at least 80% of the people who move are men. Why do women not migrate? It could be because of the cultural norms of the source region or the fact that housing in the destination regions is costly or just the fact that there is no demand for female labourers in the destination regions. One notable exception is the number of women who move from Kerala as nursing professionals!

Migration also depends a lot on caste and kin networks. If a few individuals from a region get good employment opportunities in another region, they facilitate the migration of members of their family and extended caste networks. This facilitation could be in the form of contacts with potential employers, places to live and the comfort of connection with people of home culture. Thus, not only are economic migrants across the country from the same regions, but also in a particular destination / employment, you would see people from the same village / cast combinations.

Does the source region benefit?

Economic migrants would send money back home and that should benefit the region, right? The record is mixed. The Udipi region is the second best in Karnataka on development indicators and sees persistent outmigration. Goa is one of the more prosperous states and also has a very high level of outmigration for employment. A lot of the prosperity of these regions may be from remittances of the migrants. The poster example of benefiting from remittances however,  is Kerala. It has been estimated that nearly 30% of Keral GDP is inbound remittance!

However, the Bhojpuri speaking region of UP and Bihar does not seem to have benefited as much from migration. The difference could be due to governance or due to the amount of remittances. The remittance market in India is estimated to be $70 Billion for international migration but only $20 Billion for internal migration. Nearly 40% of international remittance flows are concentrated in Kerala, Punjab and Goa whereas domestic remittance dependency is high in UP, Bihar, Rajasthan and Odisha.

Where do they go?

The destination regions have changed over the centuries and may be in our outside India and depend totally on the available economic opportunities. Kolkata, Surat and Mumbai have been destinations for a long time.  Before the administrative division of British India, the erstwhile Burma was a popular destination. By the 1930s 7% of the total population of Burma and over half of the population of Rangoon city was of Indian origin. In more recent times, New Delhi has become a big magnet for migrants as have destinations in South India. Once a place has a culture of outmigration, people there find the best employment opportunities and go there.

Of course, a lot of Economic Migration was to far flung places across the globe like Fiji, islands in Caribbian and Mauritius. More recently, countries in the middle east have attracted migrants. In many of these places, people of Indian origin now outnumber others.

In summary, economic migration in India is large scale and male dominated. A few regions across the country have been sources of outmigration for decades and centuries now. The destinations for these migrants keeps changing with time – people go where there are job opportunities.

Postscript

My understanding of economic migration has been significantly increased from my reading of the book India Moving. However, I would do the book an injustice if I left you with the impression that it was only about economic migration within India. The book discusses the history of migration, diaspora, movement of people due to partition, migration of business communities like the marwaris and the Chettiars and many related topics and I highly recommend it. As an illustration of the breadth of the book, I leave you with three nuggets.

“In every decade between 1971 and 2011, India was, in fact, a country of net immigration.” 

“In April 1971, India received about 60,000 refugees on an average on a daily basis. In May, the daily average exceeded a 1,00,000. In June, it was a little under 70,000. Over 6 Million refugees had crossed over in just three months. Nearly 4 Million more refugees would arrive in the next four months.” 

“What are the two constants of the Indian diaspora? …The use of water, not toilet paper to perform ablutions and the pressure cooker…”

This is the fourth in a series on population. The first three articles can be found here

  1. Everything you wanted to know about population (but were too lazy to Google).
  2. Are the Acche Din of population growth already here?
  3. Chhath – the new national festival?

Author –

Yogesh Upadhyaya

(Yogesh Upadhyaya is one of the founders of AskHow India. Blogs are personal views.)

You can follow AskHow India (@AskHowIndia) or me (@Uppi89) on twitter or me on LinkedIn

0

Chhath – The new national festival.featured

September 17, 2019

This post is the third in a series on population in India, In the first part of this series, we looked at the growth since independece, the sex ratio and the fertility rate. In the second part we explained why even though the fertility rate is near replacement rate, the population is set to increase for decades. In this post, we will look at the variation in fertility rates across the country and the implications of that.

Last year, I saw this hoarding in Thane, which wished the people celebrating Chhath. Chhath is a festival associated with North Indians and as late as 2010, the Shiv Sena and its leaders had criticised its growing celebration in Mumbai and Thane. The poster I saw was put up by the same Shiv Sena! Presumably, the high number of immigrant voters had persuaded the Sena to think differently. In a democracy, demography is the king and we may see similar posters all across India in the coming decades.

The Sample Registration Survey 2017, tells us that the fertility rate in the 22 largest states in the country (which account for more than 98% of the population) ranges from 1.6 to 3.2! The states with the fertility rates greater than the national average of 2.2 are

State Total Fertility Rate
Bihar 3.2
Uttar Pradesh 3.0
Madhya Pradesh 2.7
Rajasthan 2.6
Jharkhand 2.5
Chattisgarh 2.4
Assam 2.3

A glance at the above table will tell us that these states account for a very large proportion of total population – Uttar Pradesh and Bihar have nearly as many people as Brazil and Japan.  These are also the poorer states.

The Economic Survey 2019 carried population projections. According to these, Uttar Pradesh, Rajasthan, Madhya Pradesh, Bihar, Chattisgarh and Jharkhand are expected to contribute to two thirds of the increase in population in the period 2021-41. This is even as the survey expects the Total Fertility Rates to fall below replacement rate of 2.1 in all states in India by 2031!

On the other end of the spectrum, states which are relatively mature in their demographic transition have already seen a peak in their younger population. The survey projects the growth rate to be close to zero in Andhra Pradesh. The growth is expected to be 0.1-0.2% in the states of Karnataka, Kerala, Telangana, Himachal Pradesh, West bengal, Punjab and Maharashtra. The furthest in this transition though is Tamil Nadu. The population of the state is expected to peak in 2031 and start declining subsequently.

The low growth rates in the states would mean a faster aging of the population. We will have a higher growth in poorer state and a very low growth in the richer states. The result? Migration will intensify! Bengaluru, Chennai, Hyderabad have already seen an influx of people from North in the last decade and it is not stopping any time soon. Sooner or later it will have political consequences. Like in Mumbai, we can expect the three stages of resentment, opposition and acceptance . Chhath nal Vazhthukal anyone?

This is the third in a series on population. The first two articles can be found here

  1. Everything you wanted to know about population (but were too lazy to Google).
  2. Are the Acche Din of population growth already here?

Author –

Yogesh Upadhyaya

(Yogesh Upadhyaya is one of the founders of AskHow India. Blogs are personal views.)

You can follow AskHow India (@AskHowIndia) or me (@Uppi89) on twitter or me on LinkedIn


0

Are Acche Din of population growth already here?featured

September 05, 2019


This is the second post in our series “Everything you wanted to know about population in India (but were too lazy to Google).” The first part on basics can be found here. 

The Prime Minister of India, in his recent Independence Day speech talked about ‘population explosion’. But, the government’s own Sample Registration System report had said a few days back, that the fertility rate in India was now only slightly higher than replacement rate fertility. Does this mean that the country’s population will plateau soon? Has the explosion already played out? Not quite. But first, the basics.

According to the SRS, the fertility rate in the country is 2.2 and the replacement rate for fertility is considered to be 2.1. This was a fact that one of our experts, Vivek Kaul, pointed out in the latest Rediscovery of India.


The United Nations, however projects that the population maximum will be reached only by 2065. Nearly half a century from now!


Why the population keeps growing even after the fertility rate reaches replacement rate is explained brilliantly by Hans Rosling. The term replacement rate can be misleading and it refers to a couple and not the whole society. So if in a population, if there are more younger people than older people, the population would keep increasing even if fertility rate is below replacement rate. In a young society, most of the females have not yet given birth to their two kids. As they do that and become middle aged, the population increases. Of course, there would be significant mortality amongst the older folk but as they were fewer in number to start with, the number of newborns, even at lower fertility rates, is much more than the number of people dying.

Let me illustrate this with an example. Suppose, the people in a country are divided as follows

Age Percentage of population
0-10 24
10-20 20
20-30 16
30-40 12
40-50 10
>50 18

In this made up population, even as the 44 people under 20 have 44 kids over the next two decades, only a maximum of 18 people who are over 50 will die during the same time leading to an increase in the total population even though fertility rate is exactly 2! (For the sake of simplicity, I have ignored the mortality across all age groups except the oldest).

There is a wide regional variation in the fertility rates in India. Bihar has a fertility rate of 3.2 and Kerala of 1.7. The rural fertility rate was 2.4 whereas the urban fertility rate was 1.7. These differences are sure to be causes of large scale internal migration in the future. And of course, a few commentators have alleged that the Prime Minister’s statement was directed at the Muslim community in particular. All these would be topics of future posts in this series!

This is the second in a series on population in India. The first part can be found here.

Author –

Yogesh Upadhyaya

(Yogesh Upadhyaya is one of the founders of AskHow India. Blogs are personal views.)

Follow Yogesh Upadhyaya @Uppi89

Follow AskHow India @AskHowIndia

0

Everything you wanted to know about population in India (But were too lazy to Google)featured

August 26, 2019


Is India overpopulated? Is the sex ratio in the country dangerously low? Is India a young country? Population related questions are often a subtext in discussions on the economy, environment and many social issues. What does the data and best analysis say on this topic? What do the experts say?

Over the next few months we will try to answer these questions and we will blog as we learn. We hope that you will point out our mistakes and more importantly raise questions that you want answered!

Three basic facts

Population growth

How large is the population in India? How much has it grown in recent decades? The answers are ‘very’ and ‘quite a lot!’. As Professor Devesh Kapur pointed out in his contribution to our most recent Rediscovery of India, the country added more people in the last twenty five years, than the total population at the time of Independence!

If we look at the last 65 years, we again see a sharp growth. The number of people increased from 376 Million in 1950 to 1,311 Million in 2015. A 3.48 times increase![1] That certainly looks like a population explosion. However, the population of the whole world grew a lot during the same time. It increased from 2.5 Billion in 1950 to 7.4 Billion in 2015. A 2.91 times increase.

So yes, the population in India has grown a lot since independence but that is true for the whole world in the last sixty five years. Of course, the population has grown faster in India that it has grown in the rest of the world.

Sex Ratio

The most basic way of classifying a population is by sex. Here is the number of women per 1,000 men in India and the world since 1950.


As can be seen, the number of women per thousand men in India has been much lower than the rest of the world. Interestingly, the number has fallen in the last 65 years both in India and in the wider world. Also, at least in India, the fall in the number seems to have flattened out.

Why has the sex ratio in India been low since 1950 (and persumably from before that)? Surely it was not because of sex selective abortion. Why did the ratio fall below 1,000 around 1955 for the world? And why has it constantly fallen since?

A young India?

We hear a lot about how India is a country with a very young population. It is true. The median age in 2015 was 26.8. However, it should be noted that India has always been a young country and in fact, the median age has been increasing in the last few decades as the following chart shows.

Summary

  • The population of India has grown a lot since Independence.The world population also grew a lot during the same period but at a lower rate.
  • The sex ratio in India has been lower than the rest of the world for the last 70 year and the sex ratio has fallen both in India and the world.
  • India has been a young country since independence. It has been growing older in the last few decades.

Follow AskHowIndia on Twitter — @AskHowIndia .

Author –

Yogesh Upadhyaya

(Yogesh Upadhyaya is one of the founders of AskHow India. Blogs are personal views.)

Follow Yogesh Upadhyaya on @Uppi89

[1] The data for this post is from UN Query tool on the web and my calculations.