Indian States — The superstars, the laggards and the mighty fallenfeatured
Authors: SR Ramanujam and Yogesh Upadhyaya
Punjab and Maharashtra were economic leaders four decades ago. They are no longer in the top 5! Rajasthan used to be a laggard and now has climbed to somewhere in the middle.
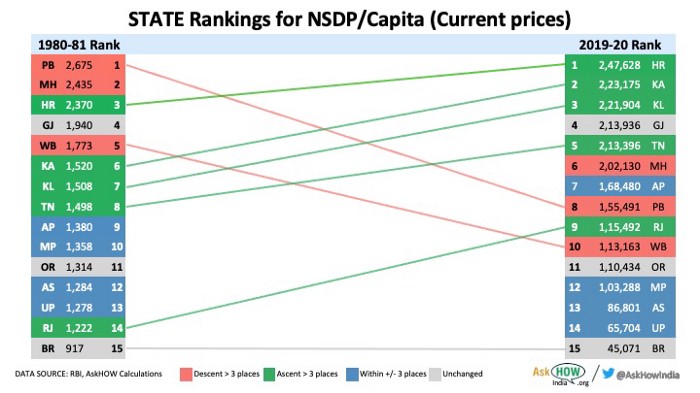
Last week, one of us wrote a post on how Uttar Pradesh has been an economic laggard for a long time now. This prompted the other to wonder how different states have done over the past few decades. We downloaded the state wise NSDP per capita from RBI and made two charts. These charts have stories to tell. From the first one.
· How the mighty have fallen: Noticeable is the fall in the rank of Punjab, Maharashtra and West Bengal. The top two states of 80–81 are not even in the top 5 now!
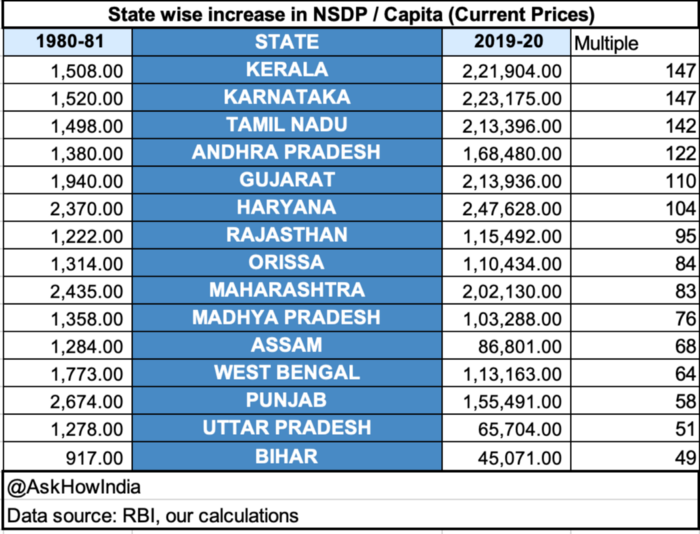
· Rising stars: Karnataka, Tamil Nadu and Kerala have done very well to break into the top five. Haryana has jumped from three to one. Gujarat has done the tough job of maintaining its ranking. Rajasthan has also done well and is no longer a back bencher.
· Back Benchers: Bihar, Uttar Pradesh, Assam and Madhya Pradesh continue to trail the rest of the field.
The comparison is on NSDP per capita. It is in current prices which means that it is not inflation adjusted and part of the income gain will go in increased costs. Also, the figures for 1980–81 and 2019–20 are from different series. So, they are not strictly comparable. With these limitations, we see that even the backbenchers have grown quite a bit which is good news.
Why did the superstars outperform? Why did the laggards stay laggard? Why did the mighty — Punjab, Maharashtra and West Bengal — fall in rankings? These questions are beyond the scope of this small post. Indeed, many books should be devoted to studying the trajectories of Punjab and Maharashtra on one hand and Haryana and Tamil Nadu on the other. If you have thoughts on any of these, be sure to leave a comment! Remember, that we are talking of a timeline of four decades and explanations based on any single political party or an event may explain very little.
Note: The numbers for Uttar Pradesh, Andhra Pradesh, Bihar and Madhya Pradesh are not strictly comparable as new states were carved out of these in the intervening decades. Also, NSDP / capita is just one measure and states may legitimately judge their performance on other measures. We do think that with all the limitations, these charts have something important to say.
SR Ramaunjam can be found on Twitter (@SRRamanujam) and LinkedIn.
Author –
Yogesh Upadhyaya
(Yogesh Upadhyaya is one of the founders of AskHow India. Blogs are personal views.)
You can follow AskHow India (@AskHowIndia) or me (@YogeshUpadh) on twitter or me on LinkedIn or Medium. DM me if you wish me to put you on WhatsApp distribution list.